. 2022 Jan 30;12(7):3809–3827. doi: 10.1039/d1ra06149f

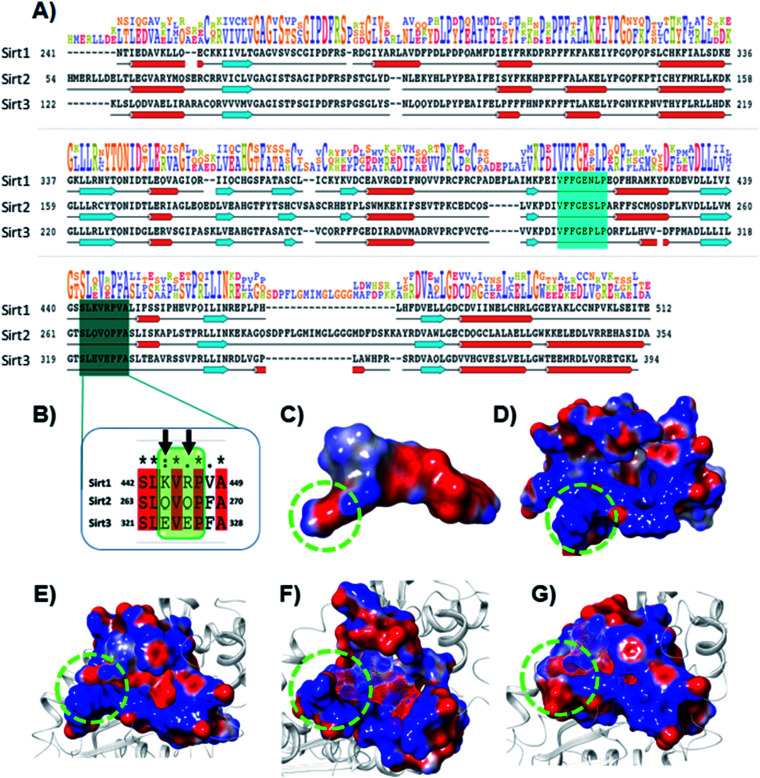
Fig. 7. Selectivity at the substrate binding site explored at the sequence and structural level. (A) The sequence alignment of Sirt1, Sirt2 and Sirt3 PDB id. 4I5I, 4RMG and 4JSR, respectively. The region highlighted in cyan and deep cyan color represents the substrate-binding site. (B) The enlarged view of the sequence alignment of lower panel of substrate binding zone of Sirt1–3 (green color box). The arrow sign marked the residues K444 and R446 that played a key role in Sirt1 selectivity of 7dvia polar electrostatic interaction. (C and D) Electrostatic surface view of ligand 7d (C) and Sirt1 binding cavity (D). (E–G) The electrostatic surface potential (ESP) complementarity analysis of 7d with Sirt1 (E), Sirt2 (F) and Sirt3 (G). Protein is shown in the solid surface, while 7d is shown in the mesh surface. The blue and red color surface represents positive and negative potential, respectively. The region highlighted with a green dotted circle highlights the selectivity zone at the substrate-binding site.

Fig. 7