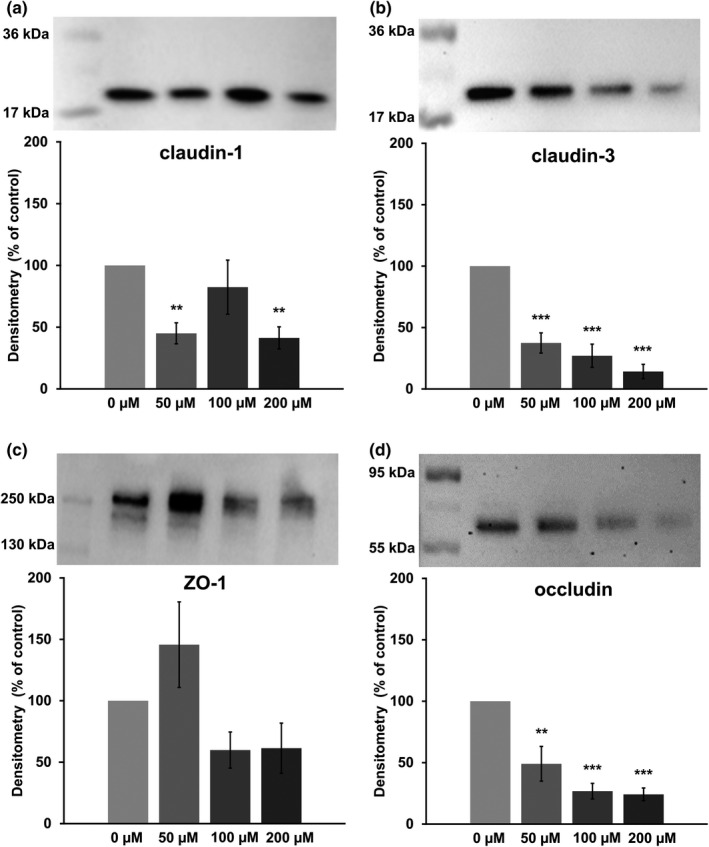
FIGURE 4.

Densitometry and representative membranes with visualized protein of claudin‐1 (a, ~22 kDa), claudin‐3 (b, ~22 kDa), ZO‐1 (c, ~250 kDa), and occludin (d, ~65 kDa) after a 24‐h incubation Claudin‐1 (a) was reduced in the 50 µM and the 200 µM groups, but not in the 100 µM group. Claudin‐3 (b) and occludin (d) were reduced dose‐dependently, and ZO‐1 (c) was not changed significantly. Data are expressed as % of control, are normalized to total protein amount, and are shown as mean ± SEM, n = 4–6. Asterisks indicate significant difference from control with ** = p < 0.01 and ***=p < 0.001
