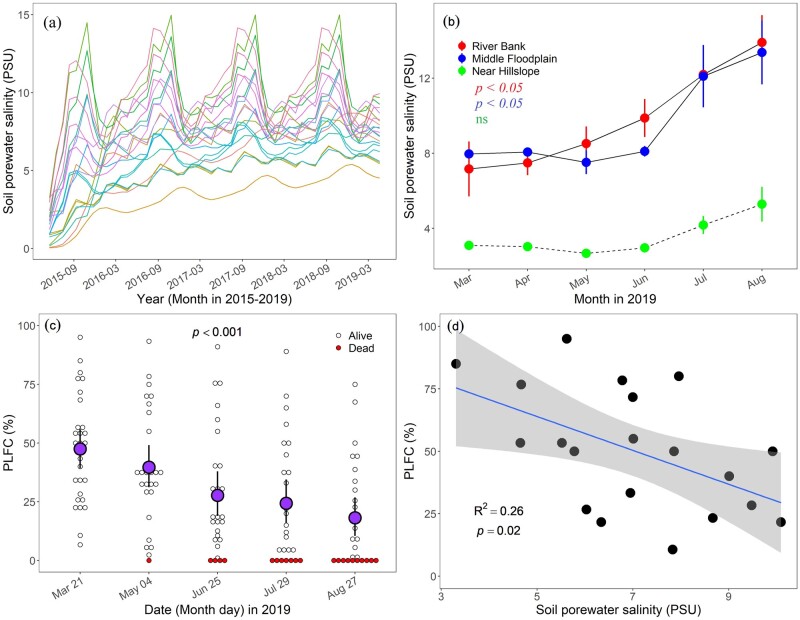
Figure 1.
The dynamics of porewater salinity and PLFC over time. A, Modeled soil porewater salinity (PSU, practical salinity units) from May 2015 to April 2019. The color of lines represents the location of our target individual trees. B, Mean porewater salinity of the floodplain sites (River Bank, Middle Floodplain, and Near Hillslope) by month (March–August) in the year 2019 [mean porewater salinity significantly increased for River Bank and Middle Floodplain over the study period (P < 0.05; ANOVA)]. Error bars represent ±1 standard error (n = 3). C, The pPLFC declined and the number of dead trees increased rapidly over the study period (from March to August 2019; P < 0.001; ANOVA). Black hollow circles and black circles filled with red represent alive and dead trees, respectively. The circles filled with purple represent the mean PLFC of all individuals. Error bars represent ±1 standard error (n = 28) of observed values. D, Relationship between PLFC and soil porewater salinity. The confidence intervals of linear or nonlinear regression were shown in light gray color. The points represent the individual trees. The coefficient of determination and P-value are also shown.

