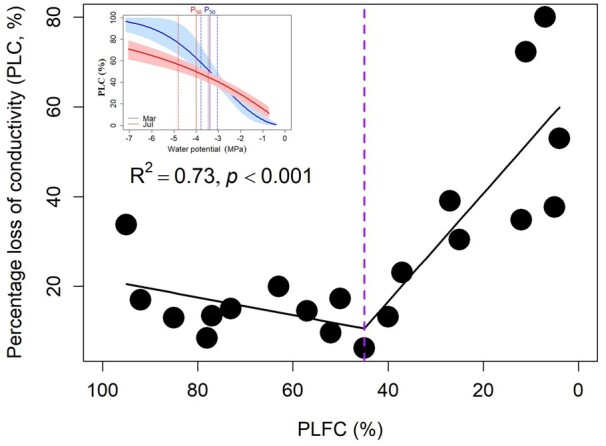
Figure 4.

Relationship between native PLC and PLFC. A segmented model with break-point estimation is fitted to the data from the “Segmented” package in program R version 3.5.3. Change-point x = 45% was shown with a purple dashed line. Insert: Vulnerability curves of sitka-spruce (Picea sitchensis) generated in March and July. The water potential at 50% of conductivity lost (P50) are −3.38 MPa and −4.00 MPa for March (is shown with solid blue line) and July (is shown with solid red line), respectively. The confidence intervals of the regressions are shown in light blue and light red color, respectively. The 95% confidence interval for P50 are shown with dashed lines. The curves were fitted using R package “fitplc.”
