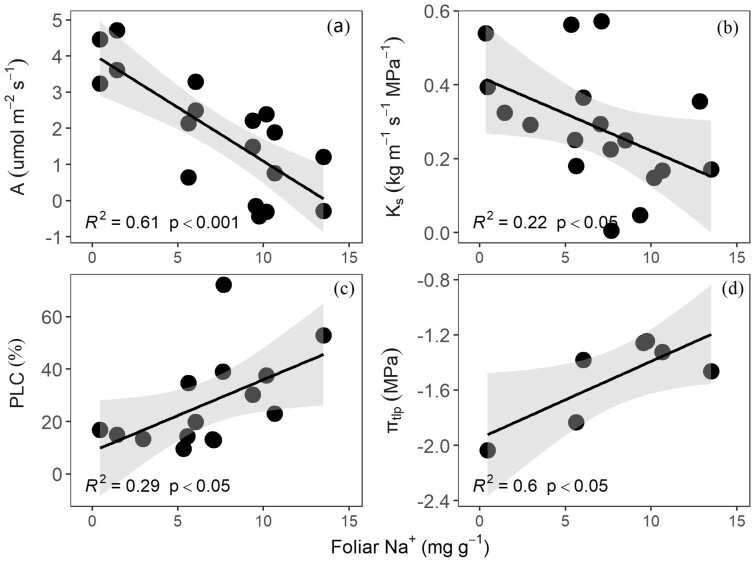
Figure 6.
Relationship between foliar Na+ concentration and tree key functional traits. Traits are carbon assimilation rate (A; A), sapwood-specific hydraulic conductivity (Ks; B), native PLC (C), and turgor loss point (πtlp; D). A linear model is fitted to the data in each panel. The points represent the individual trees. The confidence intervals of the linear regressions are shown in light gray color. The coefficients of determination and P-values are also shown.

