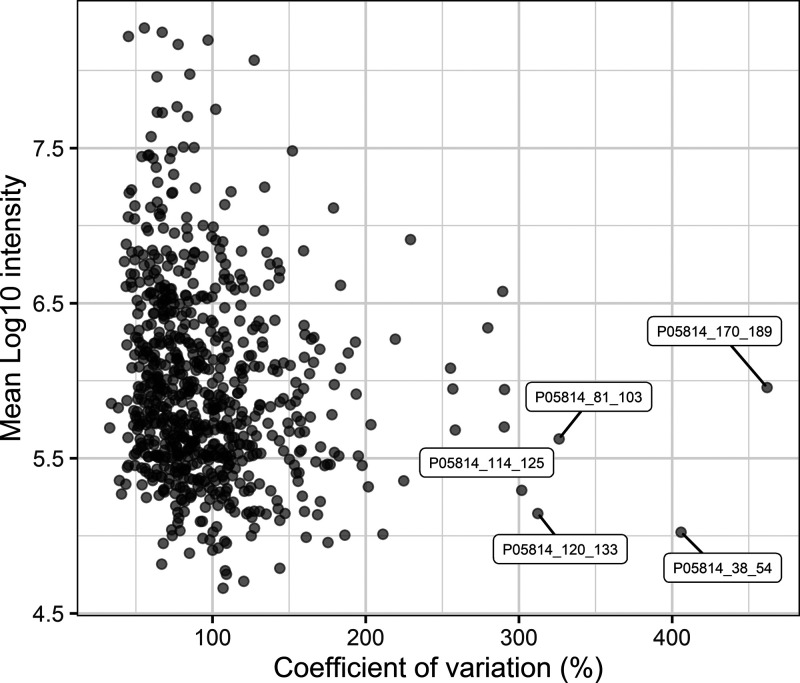
Figure 5.
Distribution of the variation of peptides. The overall CV (%) on the x-axis versus the mean log10 of the LFQ intensities for each identified peptide on the y-axis. Peptides with the largest variation are labeled with the UniProt ID of their respective precursor protein and their range in the protein sequence.

