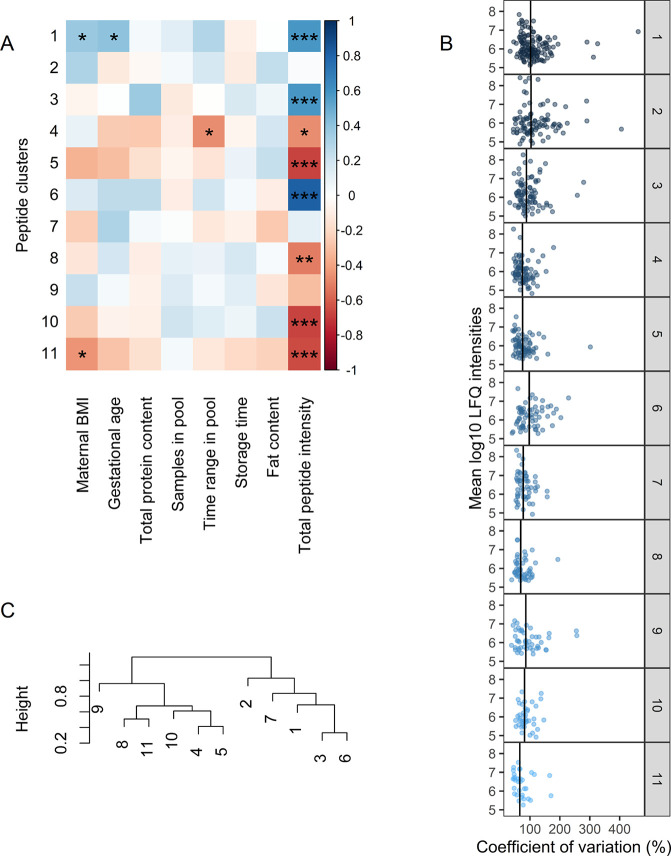
Figure 6.
(A) Association of peptide clusters with subject and sample characteristics using Spearman correlation. Significant correlations are annotated with ∗ (p < 0.05), ∗∗ (p < 0.01), or ∗∗∗ (p < 0.001). (B) Interindividual variation (%) in peptides per WGCNA cluster. Vertical lines indicate the median CV of the cluster. (C) Hierarchical clustering of the eigenpeptides of each cluster.

