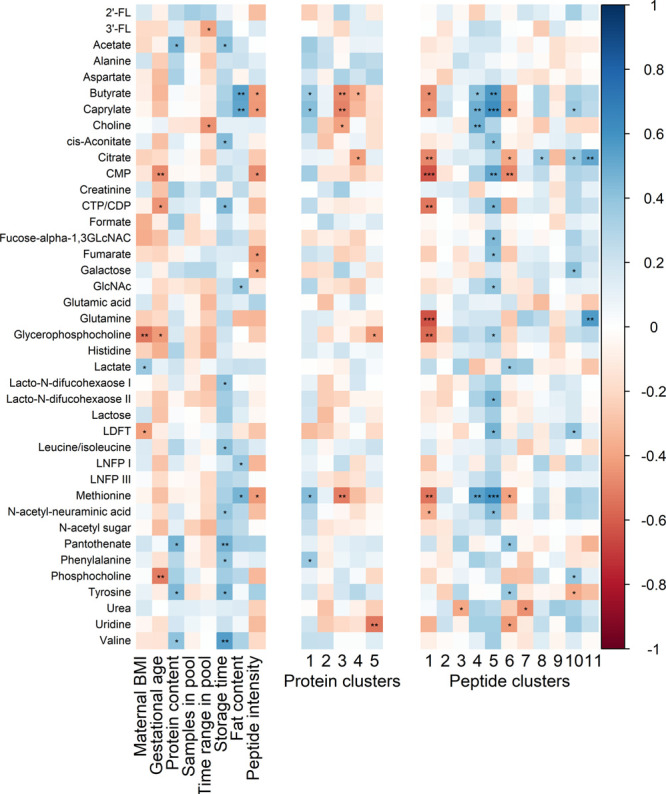
Figure 9.

Associations of metabolites with subject and sample characteristics (left) eigenproteins (middle) and eigenpeptides (right). Significant correlations are annotated with ∗ (p < 0.05), ∗∗ (p < 0.01), or ∗∗∗ (p < 0.001).

Associations of metabolites with subject and sample characteristics (left) eigenproteins (middle) and eigenpeptides (right). Significant correlations are annotated with ∗ (p < 0.05), ∗∗ (p < 0.01), or ∗∗∗ (p < 0.001).