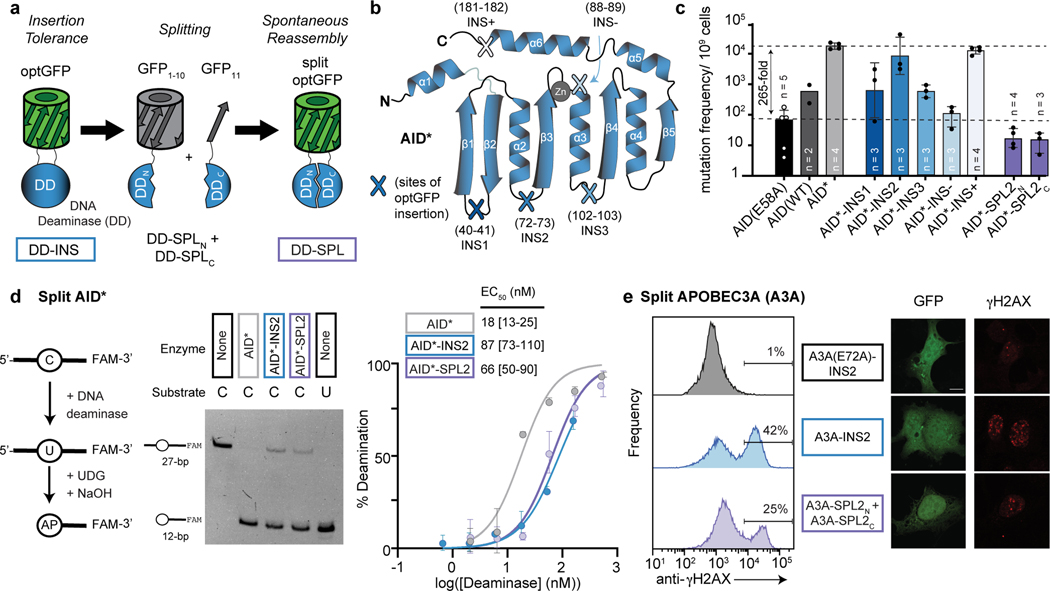
Figure 1. Split deaminases show activity in vitro and in cells.
(a) Strategy for testing insertion tolerance followed by split tolerance of DNA deaminases (DD). Constructs with inserted optGFP (DD-INS) are split within optGFP to yield fragments DD-SPLN and DD-SPLC. Spontaneous GFP assembly (DD-SPL) upon co-expression can restore DNA deaminase activity by approximating split fragments. (b) Schematic showing the topology of the DNA deaminase fold, with the active site defined by Zn-interacting residues. Selected sites targeted for insertional mutagenesis in AID* are highlighted. (c) Mutation frequency, as measured by the frequency of acquired rifampin resistance upon expression of AID variants in E. coli. AID(E58A), catalytically inactive control. Each individual data point is indicated on the log-scale plot, with mean and standard deviation. (d) Left—an in vitro assay to measure deaminase activity on a 3’-fluorescein (FAM) labeled oligonucleotide substrate. UDG, uracil DNA glycosylase. AP, abasic site. Middle—a representative denaturing gel (100 nM DNA, 200 nM enzyme) showing substrate (C) and product (U) controls, highlights that the spontaneously-assembled AID*-SPL2 is active. Right—product formation was quantified as a function of enzyme concentration (n = 3) and fit to a sigmoidal dose-response curve to determine the amount of enzyme needed to convert half of the substrate (EC50) under these fixed reaction conditions with mean and 95% confidence interval shown. (e) HEK293T cells were transfected with catalytically inactive mutant A3A(E72A)-INS2, A3A-INS2, or co-transfected with A3A-SPL2N and A3A-SPL2C. After transfection, cells were stained for γH2AX and analyzed by flow cytometry for both GFP and γH2AX expression. Left—representative histogram of the subset of GFP positive cells. Right—representative immunofluorescent images of transfected U2OS cells. GFP staining indicates expression or split reconstitution, and γH2AX serves as a marker of active A3A-mediated DNA damage. A 10 µm scale bar is provided. Representative experiments were repeated independently three times and the results were reproducible.

