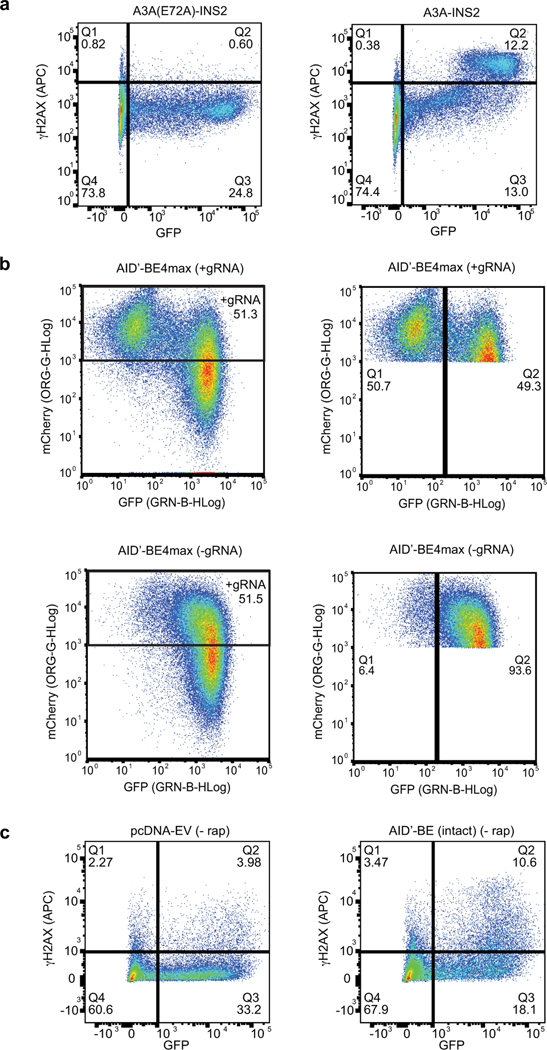
Extended Data Fig. 8. Gating strategies for flow cytometry plots.
For all samples, viable cells were selected based on a forward scatter vs side scatter plot. Viable cells were then analyzed by the gating strategies shown. (a) Gating strategy for intact, inserted, and split A3A constructs shown in Figure 1e and Extended Data Figure 2d. (b) Gating strategy for base editing constructs generating GFPOFF cells shown in Figure 2c and Extended Data Figure 4a. Left - After sorting for live cells, a second gate for efficiently transfected cells was applied. Right – the GFPOFF population was then quantified. (c) Gating strategy for AID’- and A3A-based BE4max and seBE4max constructs shown in Figure 4d and Extended Data Figure 4e.

