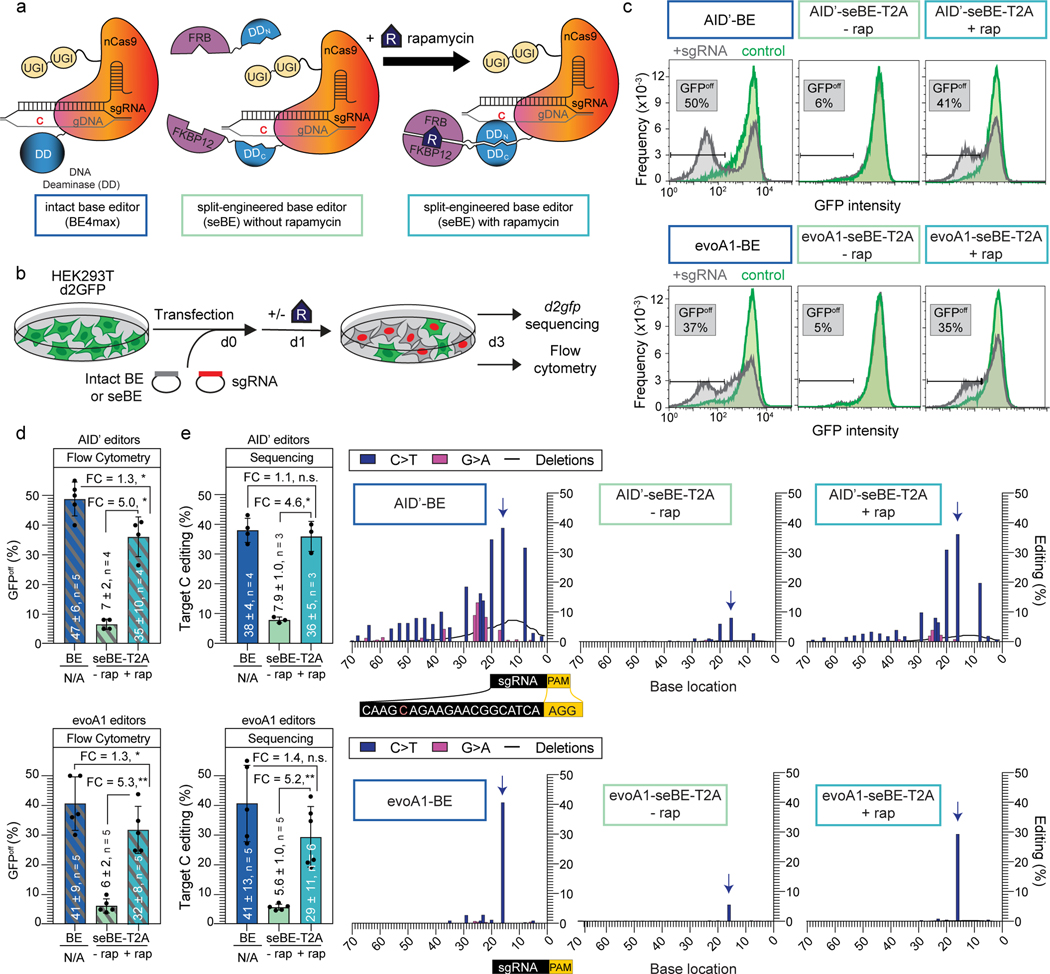
Figure 2. Split-engineered base editors represent a generalizable strategy to enable small-molecule-controlled editing.
(a) Schematics of a traditional intact base editor in the BE4max scaffold and the split-engineered base editor (seBE) strategy, including chemically induced dimerization of FRB and FKBP12 by rapamycin. (b) Editing efficiency can be evaluated in a HEK293T cell line containing a single copy of integrated, constitutively expressed d2gfp. The presence of d2gfp-targeting sgRNA can introduce a stop codon (Q158*) and abrogate fluorescence to generate GFPoff cells, which can be tracked by either flow cytometry or deep-sequencing of the locus. (c) Representative flow cytometry histograms associated with transfection of intact or seBE constructs in the presence or absence of rapamycin. (d) Mean and standard deviation for quantification of GFPoff cells by flow cytometry, with individual data points shown. Two-sided Mann-Whitney test was performed to compare intact and split base editor GFPoff % (*p ≤ 0.05; **p ≤ 0.01) Exact p-values provided as statistical source data files. (e) Left—deep sequencing results demonstrating C to T conversion efficiency of the Q158 target cytosine under conditions identical to (d). The mean and standard deviation are noted, with individual data points shown. Fold-change (FC) is the ratio of mean values for the higher versus the lower condition in each comparison. Two-sided Mann-Whitney test was performed (n.s., not significant; *p ≤ 0.05; **p ≤ 0.01) Right—editing footprints across the d2gfp locus for each condition. The full targeting sequencing is provided with the sgRNA protospacer (black) starting 20 bp from the PAM (yellow) and the target C highlighted in red. In the editing footprint, the target cytosine base within the Q158 codon is noted with a blue arrow. Data represent position-wise averages of three or more biological replicates, with individual replicate data provided in Supplementary Table 1. Exact p-values provided as statistical source data files.

