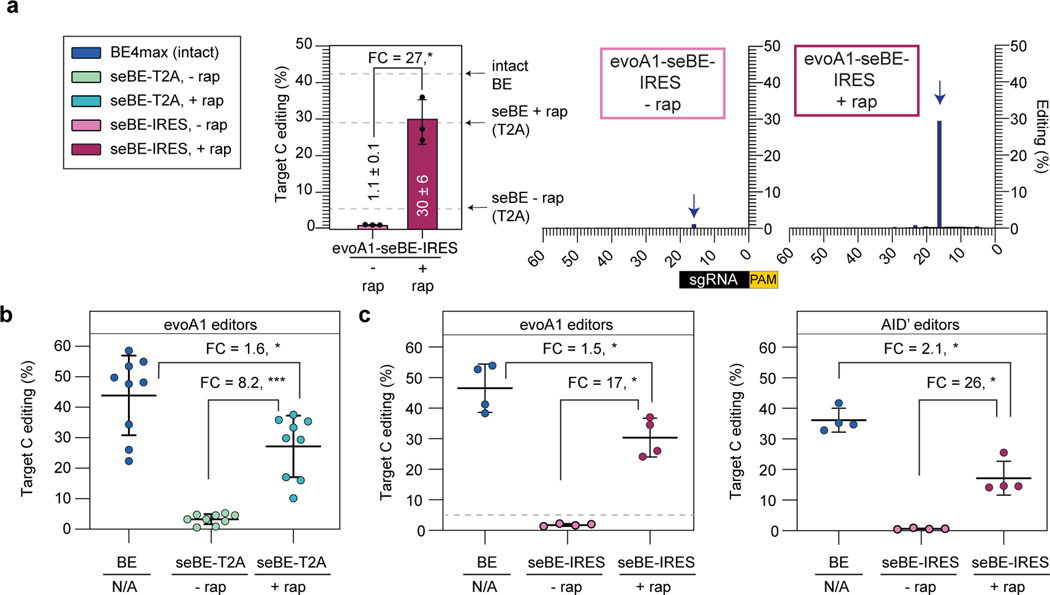
Figure 3. Split-engineered base editors permit efficient editing across genomic sites.
(a) d2gfp-HEK293T cells were edited using evoA1-seBE-IRES, where split protein fragments are independently translated. Left—deep sequencing results demonstrating C to T conversion efficiency of the Q158 target cytosine with and without rapamycin. Bars indicate means and error bars indicate standard deviations of three biological replicates. Two-sided Mann-Whitney test was performed (*p ≤ 0.05), exact p-values provided as statistical source data files. The dotted line represents the mean values for the intact evoA1-BE4max and evoA1-seBE-T2A with and without rapamycin from Fig. 2e for comparison. Right—editing footprints across the d2gfp locus for each condition. Data represent position-wise averages of three biological replicates, with individual replicate data provided in Supplementary Table 1. (b) Cells were edited with evoA1-BE4max or evoA1-seBE-T2A in the absence or presence of rapamycin. The editing efficiency across nine genomic loci involving epigenetic regulators and two well-established target sites are shown. Each data point represents three biological replicates at each target site. The mean and standard deviation across all sites is noted, with individual data points shown. The fold-change (FC) is the ratio of mean values for the higher versus the lower condition in each comparison. Two-sided Mann-Whitney test was performed (*p ≤ 0.05; ***p ≤ 0.001). Exact p-values provided in statistical source data files. The individual loci editing data are provided in Extended Data Fig. 5a. (c) Cells were edited with intact BE4max or seBE-IRES constructs in the absence or presence of rapamycin. Left—cells treated with evoA1-based constructs; Right—cells treated with AID’-based constructs. The editing efficiency across three genomic loci involving epigenetic regulators and one well-established target site (EMX1) are shown. Each data point represents three biological replicates. The fold-change (FC) is the ratio of mean values for the higher versus the lower condition. Two-sided Mann-Whitney test was performed (*p ≤ 0.05). Exact p-values provided in statistical source data files. For evoA1-seBE-IRES, the dotted line represents the mean values for the evoA1-seBE4-T2A for the same four loci without rapamycin (from Fig. 3b) for comparison. The individual loci editing data are provided in Extended Data Fig. 5b-c.

