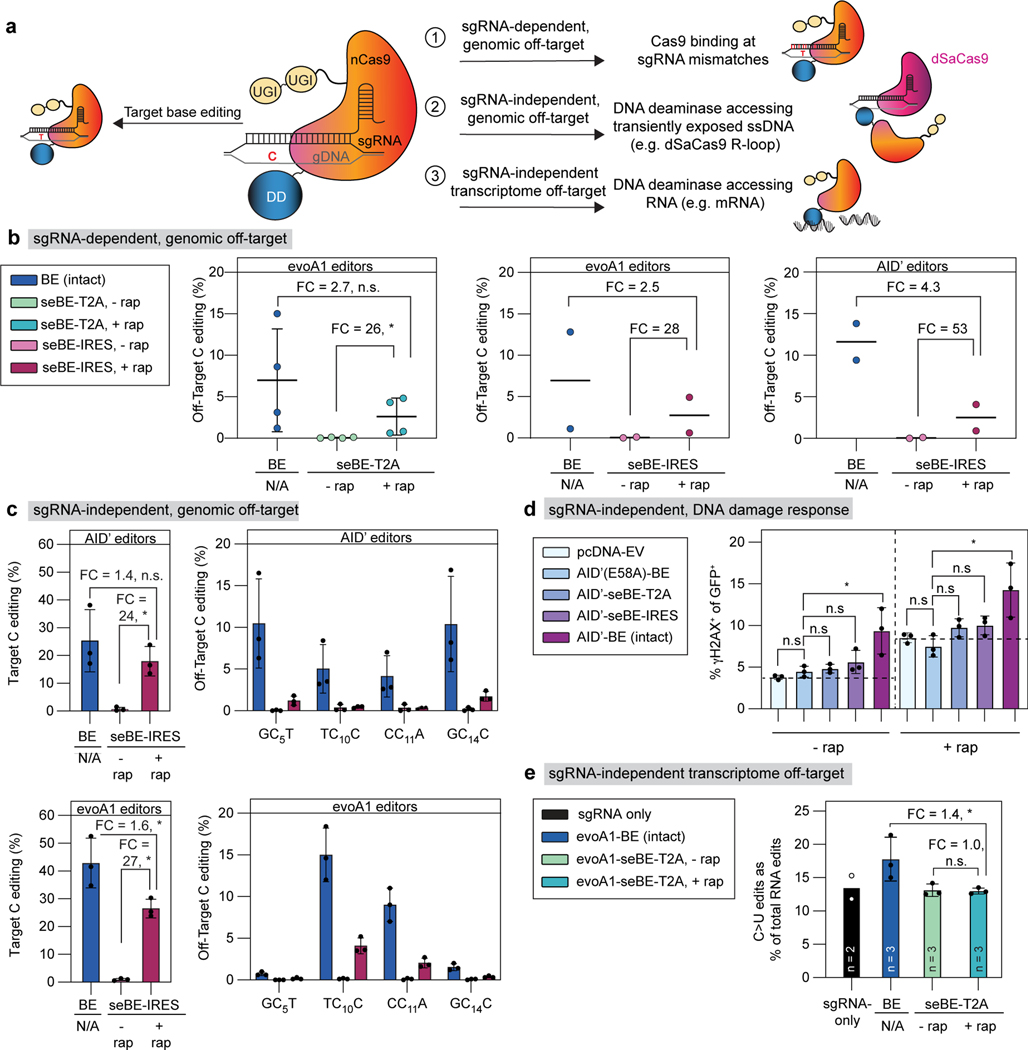
Figure 4. Split-engineered base editors decrease off-target effects.
(a) Schematic showing on-target base editing and potential sources of off-target mutagenesis. (b) Left—sgRNA-dependent off-target genomic editing was quantified in cells transfected with evoA1-BE4max or evoA1-seBE-T2A and sgRNAs targeting either EMX1 or FANCF. The mean and standard deviation from four biological replicates are shown, with individual loci editing data in Extended Data Fig. 5a. Two-sided Mann-Whitney test was performed (n.s., not significant; *p≤ 0.05, exact p-values provided in statistical source data files. Center and right—sgRNA-dependent off-target genomic editing was quantified in cells transfected with evoA1 (center) or AID’ (right) intact or seBE-IRES constructs and EMX1-targeting sgRNA. Two biological replicates and the average are shown with individual loci editing data in Extended Data Fig. 5b-c. No statistical analysis was performed due to sample size. (c) sgRNA-independent off-target genomic editing was quantified in cells transfected with AID’ (top) or evoA1 (bottom) intact or seBE-IRES constructs and EMX1-targeting sgRNA, along with dSaCas9-sgRNA targeting a different locus. Left—EMX1 on-target editing. Right—off-target editing at the locus opened by dSaCas9. The mean and standard deviation from three biological replicates are shown. Two-sided Mann-Whitney test was performed (n.s., not significant; *p ≤ 0.05, exact p-values provided in statistical source data files). Editing footprints and replicates are provided in Supplementary Fig. 4. (d) Quantification of γH2AX upon base editor expression in the absence and presence of rapamycin. HEK293T cells transfected with noted constructs and an EMX1-targeting sgRNA vector expressing GFP. Cells were either maintained with or without rapamycin and stained for γH2AX. The fraction of GFP and γH2AX positive cells are shown, with mean and standard deviation from three biological replicates. Two-sided Mann-Whitney test was performed (n.s., not significant; *p ≤ 0.05, exact p-values provided in statistical source data files). (e) The frequencies of C>U edits as a fraction of total RNA edits unique to transfected cells are shown. The mean of biological replicates and standard deviation (if n=3) are shown, with catalog of RNA edits in Extended Data Fig. 6 and Supplementary Table 2. Two-sided Mann-Whitney test was performed (n.s., not significant; *p ≤ 0.05, exact p-values provided in statistical source data files).

