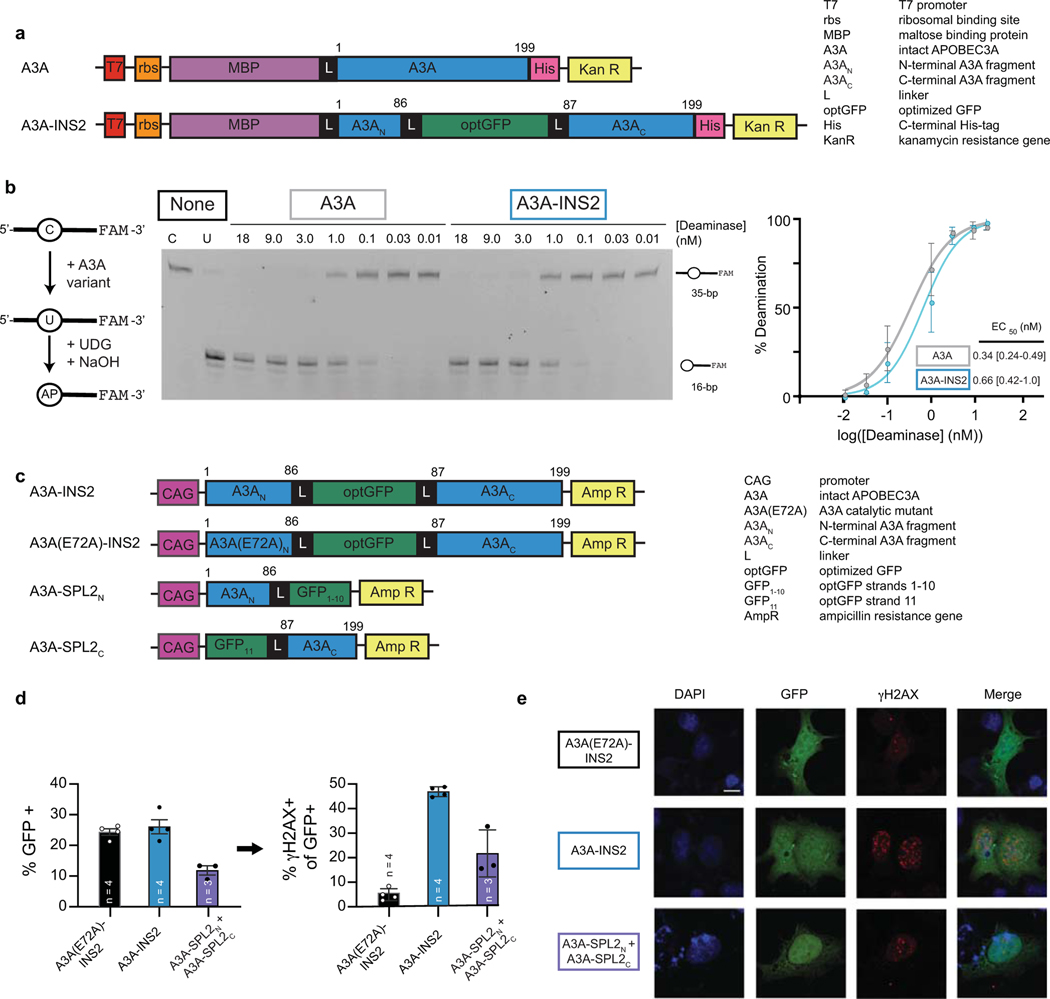
Extended Data Fig. 2. Intact, inserted, and split DNA deaminase constructs with A3A.
(a) Construct schematics for A3A and A3A-INS2 variants used to determine the impact of optGFP insertion in E. coli. Numbers above the constructs represent the amino acids of the deaminase itself. (b) Left—an in vitro assay to measure deaminase activity on a 3’-fluorescein (FAM) labeled oligonucleotide substrate. UDG, uracil DNA glycosylase. AP, abasic site. Middle—a representative denaturing gel (100 nM DNA, variable enzyme concentration) is shown, along with unreacted substrate and product controls (C and U, respectively). Right—product formation was quantified as a function of enzyme concentration (n = 3) and fit to a sigmoidal dose-response curve to determine the amount of enzyme needed to convert half of the substrate (EC50) under these fixed reaction conditions with 95% confidence interval shown. Each data point represents the mean and standard deviation across three biological replicates. (c) Construct schematics for mammalian expression of A3A-INS2, A3A(E72A)-INS2, and A3A-SPL2 variants used to determine the impact of optGFP insertion on the DNA damage response in HEK293T cells (d) HEK293T cells were transfected with catalytically inactive mutant A3A(E72A)-INS2, A3A-INS2, or co-transfected with A3A-SPL2N and A3A-SPL2C. After transfection, cells were stained for γH2AX and sorted for both GFP and γH2AX expression. The bar plot depicts frequency of GFP+ or GFP+/γH2AX+ cells after transfection of HEK293T cells with the indicated constructs, corresponding to the representative histogram shown in Fig. 1e. The mean, standard deviation, and individual observations from independent biological replicated are shown. (e) Representative immunofluorescent images of transfected U2OS cells are shown, corresponding to Fig. 1e. DAPI stain highlights the nucleus, GFP staining shows insert expression or split reconstitution, and γH2AX serves as a marker of active A3A-mediated DNA damage. A 10 µm scale bar is provided. Representative experiments were repeated independently three times and the results were reproducible.

