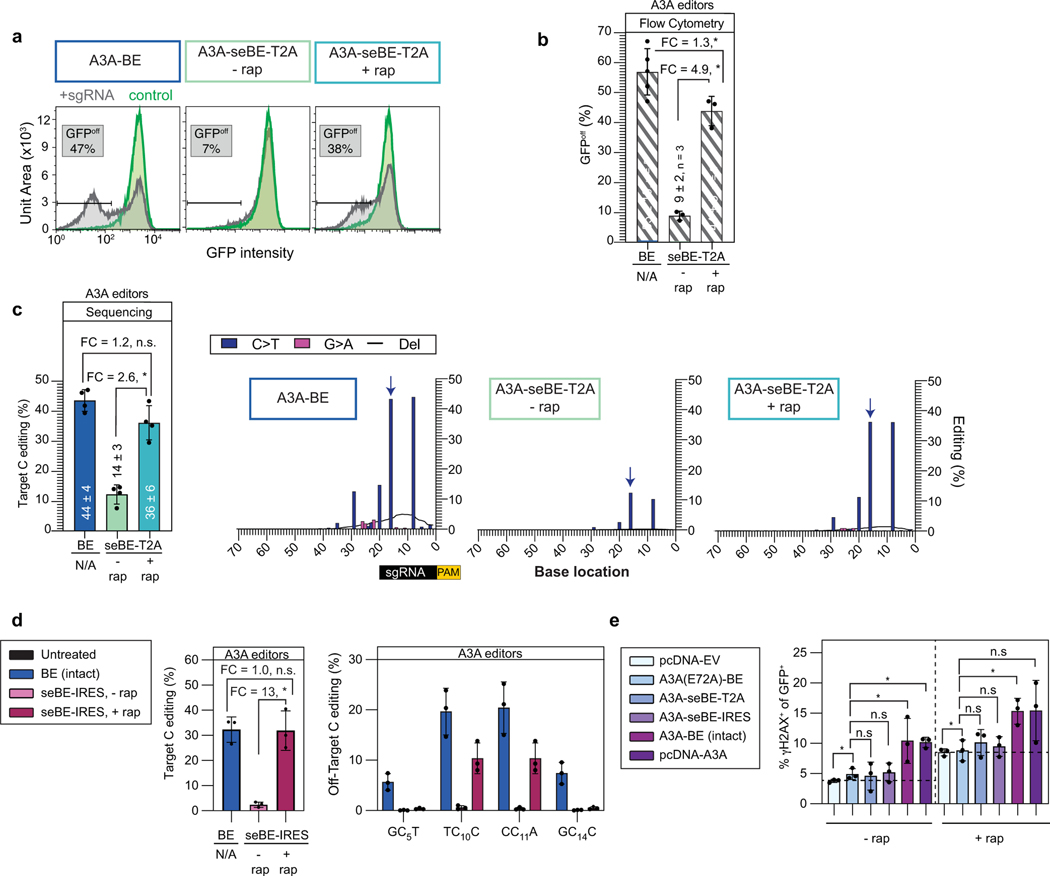
Extended Data Fig. 4. Split-engineered base editors with A3A enable small-molecule-controlled editing.
Editing efficiency is evaluated in a d2gfp-HEK293T cell line. The presence of d2gfp-targeting sgRNA can introduce a stop codon (Q158*) and abrogate fluorescence to generate GFPoff cells, which can be tracked by either flow cytometry or deep-sequencing. Two-sided Mann-Whitney test was performed on all comparisons between means in this figure (n.s., not significant; *p ≤ 0.05, exact p-values provided as statistical source data files). (a) Representative flow cytometry histograms associated with transfection of intact or seBE-T2A constructs with or without rapamycin. (b) Mean, standard deviation and individual data points shown for quantification of GFPoff cells by flow cytometry (c) Left—deep sequencing results demonstrating C to T conversion efficiency at the target cytosine. The mean, standard deviation and three biological replicates are shown. Fold-change (FC) is the ratio of mean values for the higher versus lower condition. Right—editing footprints across the d2gfp locus for A3A-BE4max and A3A-seBE-T2A in the absence or presence of rapamycin. The numbers mark the distance from the PAM site. The target cytosine base is noted with a blue arrow. Data represent position-wise averages of three biological replicates, with individual replicate data provided in Supplementary Table 1. (d) sgRNA-independent off-target genomic editing in cells transfected with intact A3A-BE4 or A3A-seBE-IRES and sgRNA targeting EXM1, along with dSaCas9-sgRNA targeting a different locus. Left—EMX1 on-target editing. Right—off-target editing at the locus opened by dSaCas9. The mean, standard deviation, and three biological replicates are shown. Editing footprints for each locus and replicates are provided in Supplementary Fig. 4. (e) Quantification of γH2AX upon base editor expression with or without rapamycin. HEK293T cells were transfected with an empty vector (pcDNA-EV), catalytically inactive mutant A3A(E72A)-BE4max, A3A-seBE-T2A, A3A-seBE-IRES, intact A3A-BE4max, or isolated A3A domain (pcDNA-A3A) and an EMX1-targeting sgRNA expressing GFP. Cells were either maintained with or without rapamycin and then stained for γH2AX. Shown are the fraction of GFP and γH2AX positive cells. The mean, standard deviation, and three biological replicates are shown. individual observations are shown (n = 3). Two-sided Mann-Whitney test was performed (n.s., not significant; *p ≤ 0.05, exact p-values provided as statistical source data files).

