. 2022 Feb 8;12(8):4714–4759. doi: 10.1039/d1ra08452f

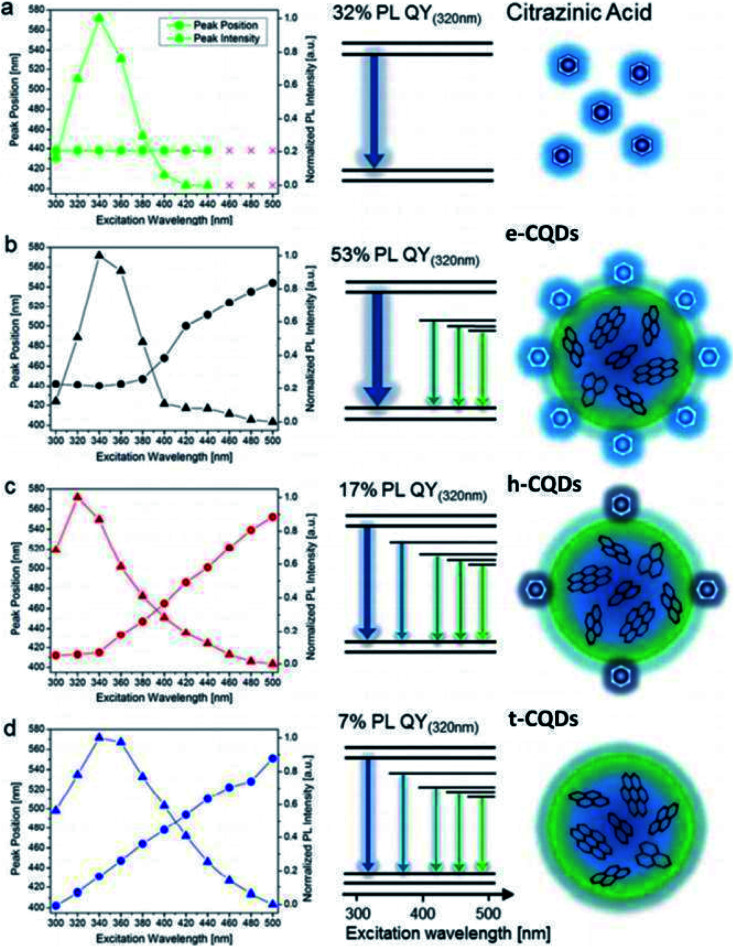
Fig. 16. PL peak position (●) and normalized PL intensity (▲) as a function of the excitation wavelength for citrazinic acid (a) and the three CQD species (b–d). Emission pathways are illustrated in the simplified Jablonski diagrams: the arrow colors represent the shift in the emission wavelengths from blue to green (high to low energies), and arrow thickness indicates the relative intensities of different transitions. Schematic structures for each CQD species are drawn on the right. The attachment of molecular fluorophores is depicted by the hexagons for both e- and h-CQDs (this figure has been adapted/reproduced from ref. 104 with permission from the American Chemical Society, Copyright 2016).

Fig. 16