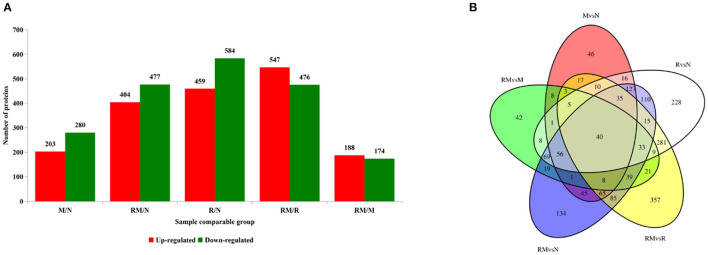
Figure 3.
Distribution of differentially accumulated proteins (DAPs). (A) Number of upregulated (red) and downregulated (green) DAPs in M vs. N, R vs. N, RM vs. N, RM vs. M, and RM vs. R. (B) Venn diagram to show the distribution of DAPs between RM vs. N (blue circle), RM vs. R (yellow circle), RM vs. M (green circle), R vs. N (white circle), and M vs. N (red circle). N, mock-infected CEF cells; R, REV-infected CEF cells; M, MDV-infected CEF cells; RM, REV and MDV coinfected CEF cells. CEF, chicken embryo fibroblast; REV, reticuloendotheliosis virus; MDV, Marek's disease virus.

