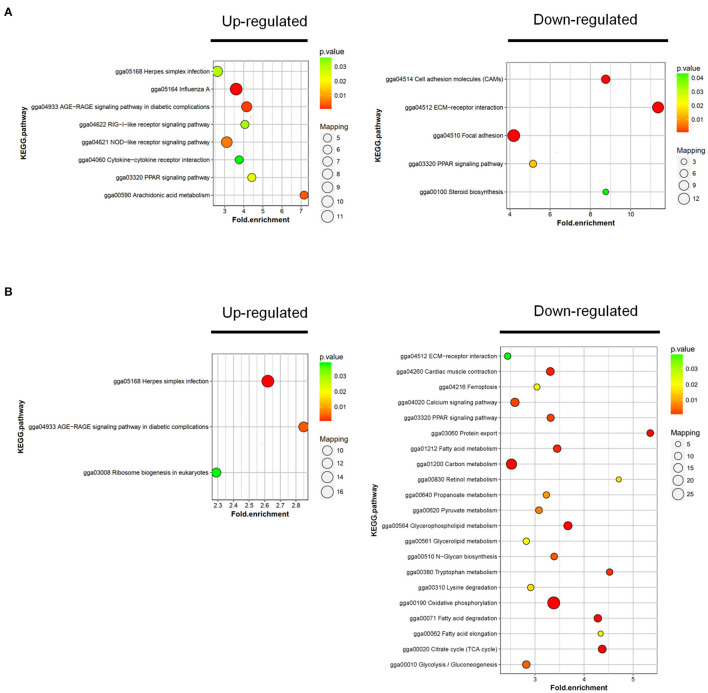
Figure 5.
KEGG cluster and pathway enrichment analysis of DAPs. Statistics of KEGG enrichment in RM vs. M (A) and RM vs. R (B). The pathway enrichment statistical analysis was performed by Fisher's exact test. The x-axis is folded enrichment; the y-axis is enrichment pathway. The mapping is the protein number. The color indicates the significance of the enrichment (p-value). The darker the color, the more significant the enrichment of the pathway. R, REV-infected CEF cells; M, MDV-infected CEF cells; RM, REV and MDV coinfected CEF cells. KEGG, Kyoto Encyclopedia of Genes and Genomes; DAPs, differentially accumulated proteins; REV, reticuloendotheliosis virus; MDV, Marek's disease virus.

