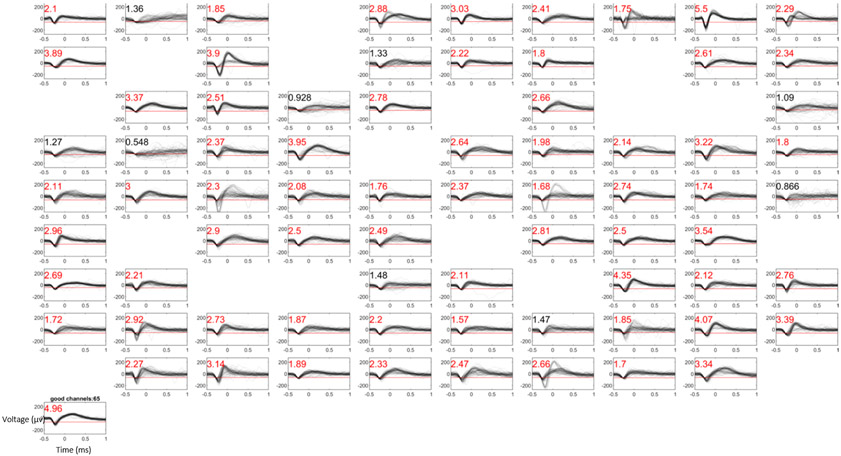
Figure 1.
Example waveforms and signal-to-noise ratio (SNR) from a UEA recording session (Subject Mk, array MkM1c). SNR values are presented in the top left corner of each panel. Red SNR values indicate electrodes which exceeded the requisite SNR threshold of 1.5 to be considered as “good” electrodes included in subsequent analyses of array yield. The red line in each panel indicates the threshold across which a waveform must cross to be considered an action potential. Empty panels indicate electrodes in which less than fourteen spikes were detected within the given recording session, and therefore were not included in analysis.

