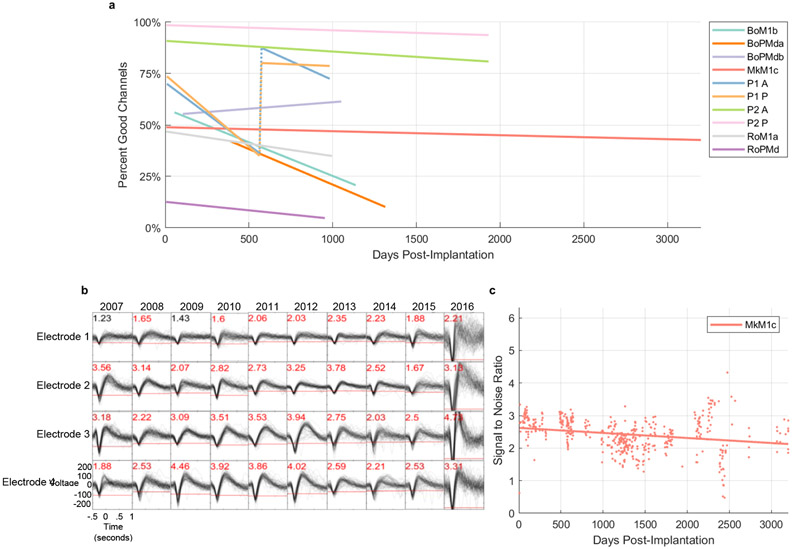
Figure 4. Extended long-term performance for a subset of arrays.
a. Yield for long-term array implants as a function of days post-implantation. Lines indicate best fit linear regressions to the data for each array. All linear regressions are statistically significant (p < .05), save for “BoPMdb”, the only array whose regression displayed an upward trend. The recording quality metrics exhibit a discontinuity at day 565 for subject P1, due to a change in the spike threshold from −5.25 to −4.5 RMS, indicated by the vertical dashed lines. b. Example spike waveforms from one array implant (MkM1c) at regular intervals over nearly 9 years. SNR values are presented at the top left corner of each panel (red font denotes electrodes that exceeded an SNR threshold of 1.5). c. SNR of Monkey Mk’s recordings, over the lifetime of the implant.

