Figure 5.
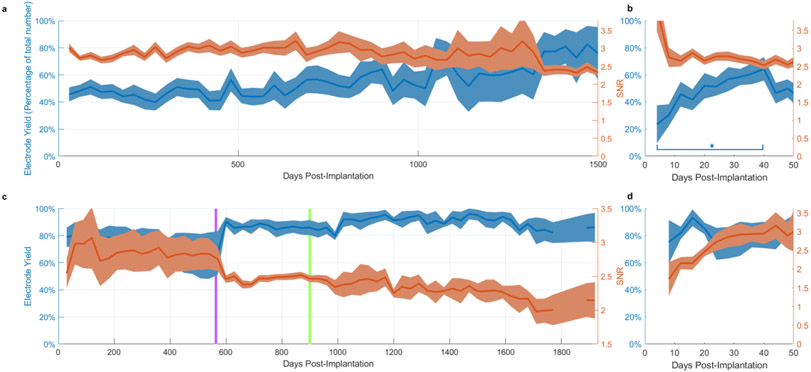
Reliability of viable chronic recordings over time. Shaded regions denote standard error of the mean. a. Average yield (blue) and SNR (red) over arrays with viable recordings (i.e. array recordings that were not terminated) versus number of days post-implantation for NHP implants. Full time range not shown (maximum lifetime is in excess of 3000 days). b. Close-up of average yield and SNR over the first 40 days post-implantation. A significant difference was observed between the first week and fourth week of recordings (p = 0.0122, 2-sample t-test, 2-tailed). c,d. equivalent statistics for human implants. Further details can be found in Downey et al., 2018 (8). The purple vertical line indicates the date at which the R.M.S. spike threshold was set to a different value during data collection (see methods for details). The change in the figure is due to a larger number of recordings becoming possible to average across, reducing variance in the estimate of yield and SNR. The green line indicates the date data collection with P1 ended.

