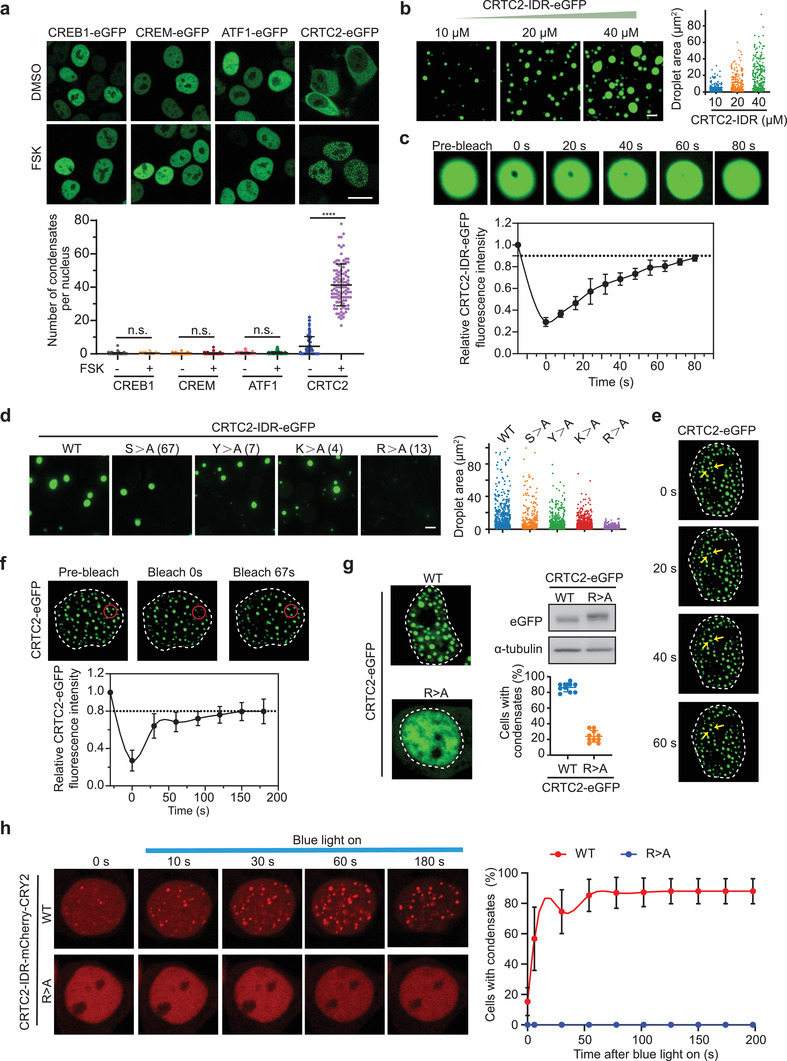
Figure 1.

cAMP signaling induces CRTC2 nuclear translocation and condensate formation. a) Live‐cell imaging of ectopically expressed CRTC2‐eGFP, CREB‐eGFP, CREM‐eGFP, and ATF1‐eGFP in 293T cells without (DMSO) and with forskolin (FSK) treatment (upper). Quantification of condensates number per nucleus (lower). b) In vitro droplet formation assay with recombinant CRTC2‐IDR‐eGFP at different protein concentrations (left). Quantification of the size of droplets (right). c) Representative images of the in vitro FRAP experiment with recombinant CRTC2‐IDR‐eGFP (upper). Quantification of FRAP data for CRTC2‐IDR‐eGFP puncta (lower). d) In vitro droplet formation assay of recombinant eGFP fusion proteins fused with wild‐type (WT) CRTC2‐IDR or CRTC2‐IDR mutants (left). Quantification of the size of droplets (right). e) Live‐cell imaging of ectopically expressed CRTC2‐eGFP in 293T cells. Arrows indicate representative CRTC2 puncta that fused over time. The dotted line area indicates the nucleus. f) Representative images of the FRAP experiment with ectopically expressed CRTC2‐eGFP in 293T cells (upper). The dotted line area indicates the nucleus. Quantification of FRAP data for CRTC2‐eGFP puncta (lower). g) Live‐cell images of ectopically expressed WT CRTC2‐eGFP or CRTC2‐IDR‐R>A mutant (R>A‐eGFP) in 293T cells (left). Quantification of cells with eGFP foci and western blot analysis of CRTC2‐eGFP or CRTC2‐IDR‐R>A expression (right). h) Live‐cell snapshots of ectopically expressed mCherry‐CRY2 fusion proteins fused with WT CRTC2‐IDR (upper) or CRTC2‐IDR‐R>A mutant (lower) in 293T cells before and after blue light stimulation (left). Quantification of cells with mCherry foci before and after blue light stimulation (right). Data are presented as means ± SEM. The unpaired two‐sided Student's t‐test was used for statistical analysis. ****p < 0.0001. n.s., not significant. Scale bar, 5 µm (a), 10 µm (b,d). All results are from more than three independent experiments.
