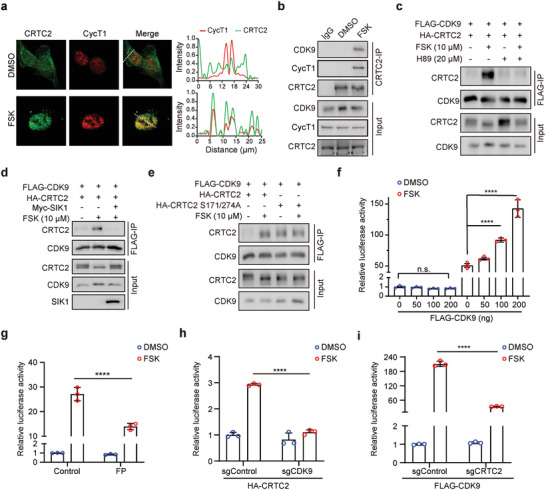
Figure 2.

P‐TEFb interacts with CRTC2 and enhances CRTC2‐dependent transcription. a) Immunofluorescence analysis of the co‐localization of CRTC2 and CycT1 in HeLa cells treated with DMSO or FSK (left). Line scans along the dotted lines in the images (right). b) Co‐IP assay examining the interaction between endogenous CRTC2 and P‐TEFb in 293T cells treated with DMSO or FSK for 1 h. c) Co‐IP assay examining the interactions between FLAG‐CDK9 and HA‐CRTC2 in 293T cells treated with the indicated concentration of FSK or H89. d) Co‐IP assay examining the interactions between FLAG‐CDK9 and HA‐CRTC2 in 293T cells ectopically expressing Myc‐SIK1. e) Co‐IP assay examining the interactions between FLAG‐CDK9 and HA‐CRTC2 (WT or S171/274A mutants) in 293T cells. f) Quantification of CRE‐luc luciferase activity in 293T cells transfected with the indicated amounts of FLAG‐CDK9 plasmids and treated with DMSO or FSK (10 µm) for 6 h. g) Quantification of CRE‐luc luciferase activity in 293T cells treated with flavopiridol (FP, 300 nm) and FSK (10 µm) for 6 h. h) Quantification of CRE‐luc luciferase activity in HA‐CRTC2‐expressing 293T cells infected with lentivirus carrying sgRNA against CDK9 (sgCDK9) or GFP (sgControl) and treated with DMSO or FSK (10 µm) for 6 h. i) Quantification of CRE‐luc luciferase activity in FLAG‐CDK9‐expressing 293T cells infected with lentivirus carrying sgRNA against CRTC2 (sgCRTC2) or GFP (sgControl) and treated with DMSO or FSK (10 µm) for 6 h. Data are presented as means ± SEM. The unpaired two‐sided Student's t‐test was used for statistical analysis. ****p < 0.0001; n.s., not significant. All results are from more than three independent experiments.
