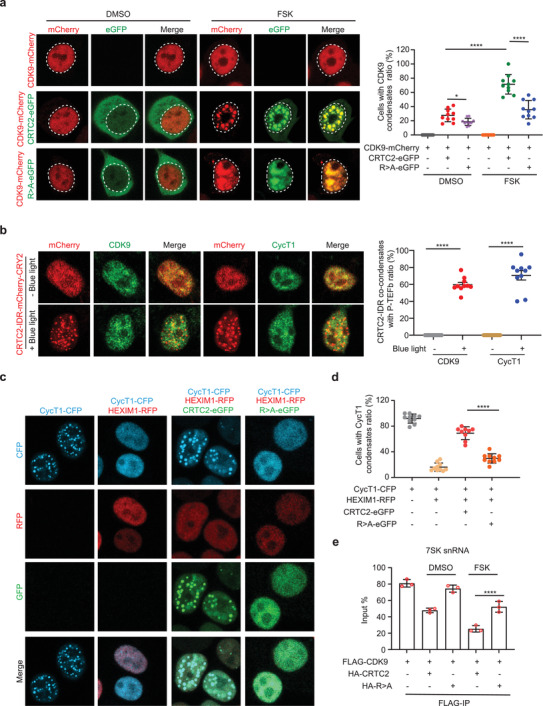
Figure 3.

CRTC2 extracts P‐TEFb from HEXIM1‐containing inhibitory complex. a) Live‐cell imaging of 293T cells co‐expressing CDK9‐mCherry and CRTC2‐eGFP or R>A‐eGFP and treated with DMSO or FSK (10 µm) for 1 h (left). The dotted line area indicates the nucleus. Quantification of cells with CDK9‐mCherry foci upon treatment with DMSO or FSK (right). b) Immunofluorescence analysis of co‐condensates of CRTC2‐IDR‐mCherry‐CRY2 with CDK9 or CycT1 in 293T cells before or after blue light stimulation (left). Quantification of cells with CRTC2‐IDR co‐condensates with CDK9 or CycT1 (right). c) Live‐cell imaging of 293T cells co‐expressing CycT1‐CFP, HEXIM1‐RFP, CRTC2‐eGFP, and R>A‐eGFP as indicated. d) Quantification of cells containing CycT1‐CFP foci. e) RNA‐IP assay examining the association between FLAG‐CDK9 and 7SK snRNA in 293T cells co‐expressing HA‐CRTC2 or HA‐R>A and treated with DMSO or FSK. Data are presented as means ± SEM. The unpaired two‐sided Student's t‐test was used for statistical analysis. ****p < 0.0001. All results are from more than three independent experiments.
