Figure 4.

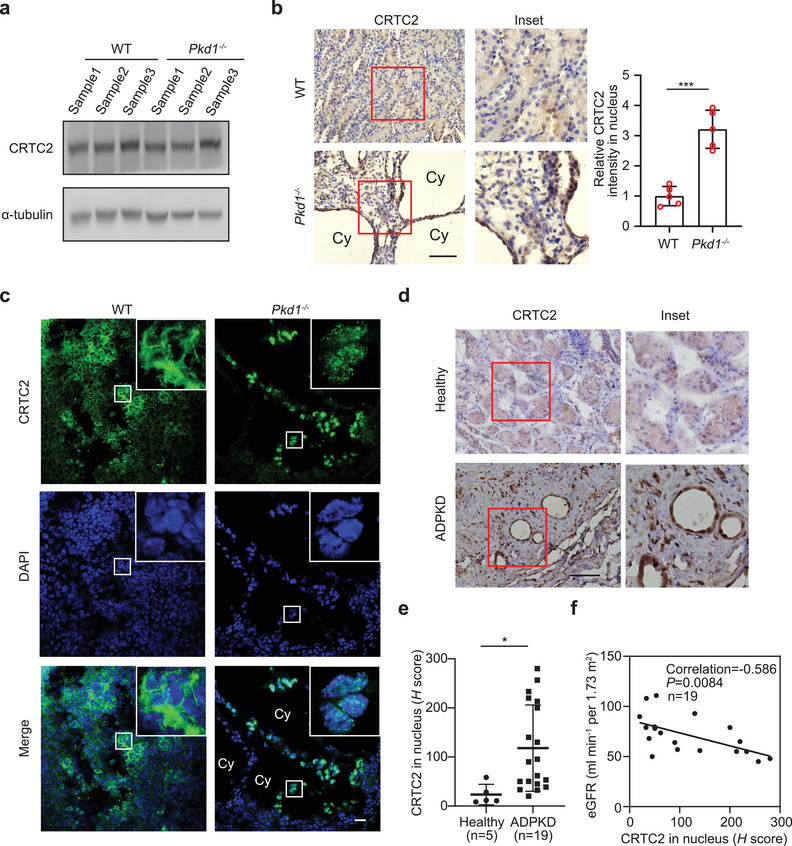
CRTC2 forms nuclear droplets in cystic epithelial cells. a) Western blot analysis of CRTC2 levels in kidneys from WT and Pkd1−/− mice (n = 3). b) Representative immunohistochemistry (IHC) images of CRTC2 in kidneys of WT and Pkd1−/‐ mice (left). Quantification of the signal intensity of nuclear CRTC2 (right) (n = 5). Cy, large cyst. c) Representative IF images of CRTC2 in the kidney of WT and Pkd1−/‐ mice. Cy, large cyst. d) Representative IHC images of CRTC2 in kidneys from healthy people (n = 5) and ADPKD patients (n = 19). e) Quantification of the signal density of nuclear CRTC2 of (d). f) Correlation between the signal intensity of nuclear CRTC2 and eGFR in patients with ADPKD. Pearson's correlation coefficients are displayed for each graph. p values for (f) were determined using linear regression analysis. Data are presented as means ± SEM. The unpaired two‐sided Student's t‐test was used for statistical analysis. ***p < 0.001, *p < 0.05. Scale bar, 20 µm (b–d).
