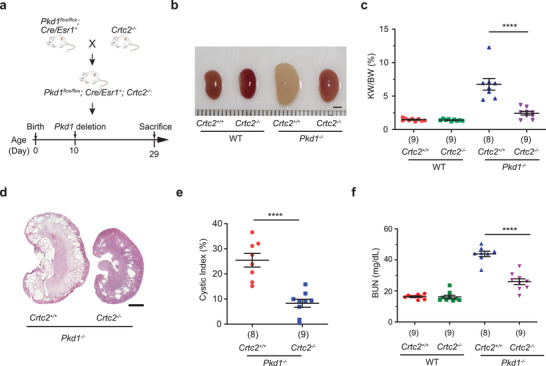
Figure 5.

Loss of CRTC2 delays cyst formation in an ADPKD mouse model. a) Experimental design of the ADPKD mouse model. b) Representative kidneys from mice at P29 with indicated genotype. (n = 8 or 9 biologically independent mice per group). c) KW/BW ratios of the indicated groups of mice in the ADPKD model. The number below each bar refers to the number of samples analyzed. d) Hematoxylin and eosin (H&E) staining of kidney sections from mice at P29 with indicated genotype. (n = 8 or 9 biologically independent mice per group). e) Cystic index of H&E‐stained kidneys from mice at P29 with indicated genotype. The number below each bar refers to the number of samples analyzed. f) Plasma BUN levels of mice from the indicated groups. The number below each bar refers to the number of samples analyzed. Data are presented as means ± SEM. The unpaired two‐sided Student's t‐test was used for statistical analysis. ****p < 0.0001. Scale bar, 2 mm (b,d).
