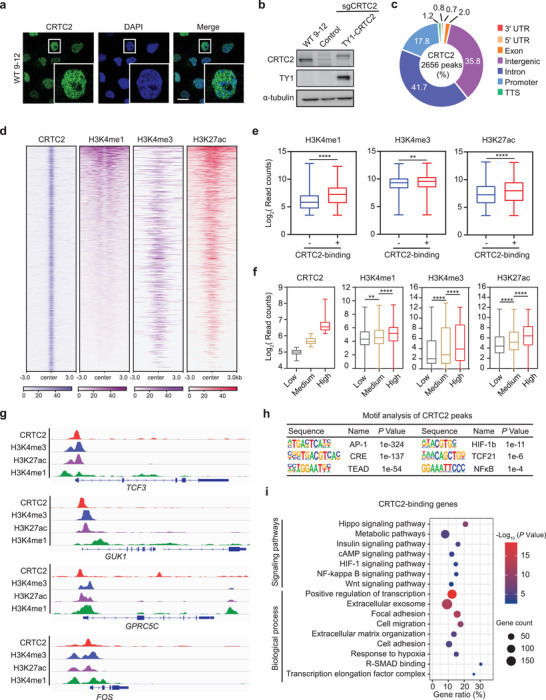
Figure 6.

Genome‐wide CRTC2 localization in human ADPKD cells. a) Representative immunofluorescence images of endogenous CRTC2 in WT 9–12 cells. The result is from more than three independent experiments. b) Western blot analysis of whole‐cell lysates from WT 9–12 cells with indicated treatment. The result is from more than three independent experiments. c) Genomic distribution of CRTC2 in WT 9–12 cells. d) Heatmaps of normalized ChIP‐seq signals for CRTC2, H3K4me1, and H3K4me3, H3K27ac. The rows show 3 kb flanking the CRTC2 peak center. e) Boxplots of the normalized counts of H3K4me1, H3K4me3, and H3K27ac signals at CRTC2 binding + or − peaks. f) Boxplots of CRTC2, H3K4me1, H3K4me3, and H3K27ac reads in the indicated groups. Low: CRTC2 reads < 39; medium: CRTC2 reads 40–70; high: CRTC2 reads > 71. g) ChIP‐seq tracks of CRTC2, H3K4me3, H3K27ac, and H3K4me1 on representative genes. h) Motif analysis of CRTC2 peaks. i) GO and KEGG pathway enrichment analyses of CRTC2‐binding genes. Data are presented as means ± SEM. The unpaired two‐sided Student's t‐test was used for statistical analysis. ****p < 0.0001, **p < 0.01. Scale bar, 20 µm (a).
