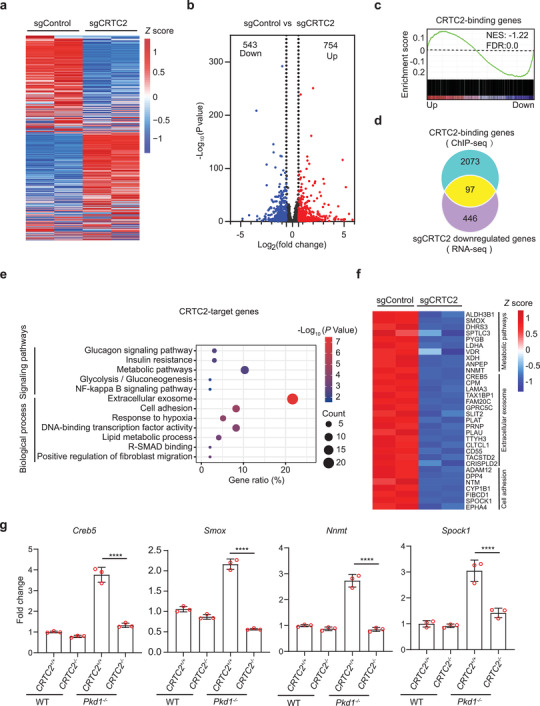
Figure 7.

CRTC2 regulates the expression of cystogenesis‐associated genes in human ADPKD cells. a) Heatmap of gene expression in WT 9–12 cells transfected with sgControl or sgCRTC2. Rows show the Z scores calculated for each group. b) Volcano plots showing differentially expressed genes. c) Gene set enrichment analysis displaying CRTC2‐binding gene set enriched for genes downregulated in sgCRTC2 cells. NES, normalized enrichment score. d) Venn diagram showing the overlap of sgCRTC2 downregulated genes and CRTC2‐binding genes, referred to as CRTC2‐target genes. e) GO and KEGG pathway enrichment analyses of CRTC2‐target genes. f) Heatmap of expression values of genes enriched in the indicated processes. Rows show the Z scores calculated for each group. g) RT‐qPCR analysis of mRNA levels of representative CRTC2‐target genes in kidneys from the indicated mouse groups. Data are presented as means ± SEM. The unpaired Student's two‐sided t‐test was used for statistical analysis. ****p < 0.0001. These results are from three independent experiments.
