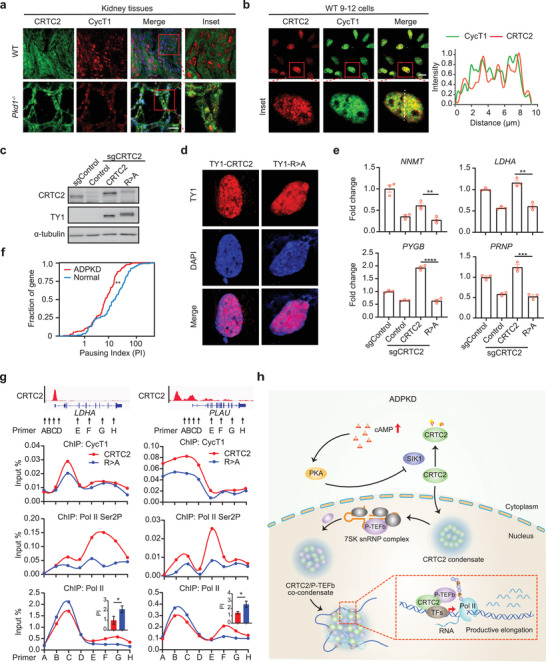
Figure 8.

CRTC2 activates cystogenesis‐associated genes by promoting paused Pol II release. a) Immunofluorescence analysis of CRTC2 and CycT1 co‐localization in the kidneys of WT and Pkd1−/‐ mice (n = 3). b) Immunofluorescence analysis of CRTC2 and CycT1 co‐localization in WT 9–12 cells (left). Line scan of the dashed line in the merged inset image (right). c) Western blot analysis of CRTC2 expression in WT 9–12 cells transfected with the indicated sgRNAs and constructs. d) Immunofluorescence analysis of ectopically expressed TY1‐CRTC2 and TY1‐CRTC2‐R>A in WT 9–12 cells with endogenous CRTC2 knocked out. e) RT‐qPCR analysis of representative CRTC2‐target genes in WT 9–12 cells transfected with the indicated sgRNAs and constructs. f) Cumulative curve of Pol II pausing index (PI) for CRTC2 target genes in normal and ADPKD kidney tissues. g) ChIP‐qPCR analysis of CycT1, Pol II Ser2P, and Pol II occupancy on LDHA and PLAU genes in WT 9–12 cells with endogenous CRTC2 replaced by TY1‐CRTC2 or TY1‐CRTC2‐R>A mutant. The inset bar graphs indicate the Pol II pausing index for LDHA and PLAU genes, respectively. h) Schematic illustration of how CRTC2 triggers the productive elongation of cystogenesis‐associated genes, ultimately leading to ADPKD progression. Data are presented as means ± SEM. The unpaired two‐sided Student's t‐test was used for statistical analysis. *p < 0.05, **p < 0.01, ***p < 0.001, ****p < 0.0001. Scale bar, 20 µm (a,b). All results are from more than three independent experiments.
