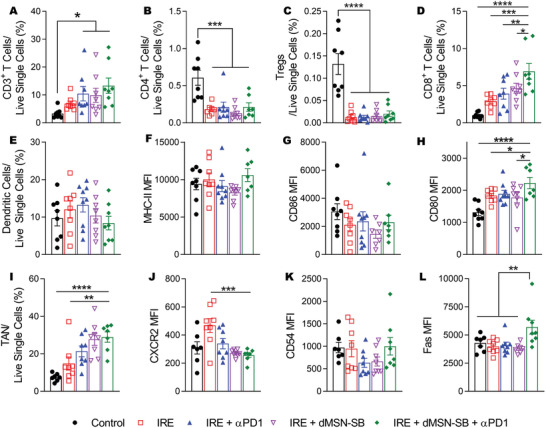
Figure 4.

Analyses of intratumoral immune cells. A–D,E,I) Relative abundance of A) CD3+ T cells, B) CD4+ T cells, C) CD8+ T cells, D) Tregs, E) dendritic cells (DCs), and I) TANs in live single cells. Identification of each cell population are listed as follows: CD3+ T cells: CD45+CD3+, CD4+ T cells: CD45+CD3+CD4+; CD8+ T cells: CD45+CD3+CD8+ T cells, regulatory T (Tregs): CD45+CD3+CD4+CD25+Foxp3+; DC: CD45+CD11c+MHC‐II+; TAN: CD45+CD11b+Ly6G+. F–H) Mean fluorescence intensity (MFI) of F) MHC‐II , G) CD86, and H) CD80 in DCs. MFI of J) CXCR2, K) CD54, L) Fas in TANs. Data are presented as mean ± SEM of n = 8 independent biological samples in bar plots overlaid with individual data points. Significance of differences was determined using one‐way ANOVA followed by Tukey post‐hoc analysis. *p < 0.05, **p < 0.01, ***p < 0.001, ****p < 0.0001.
