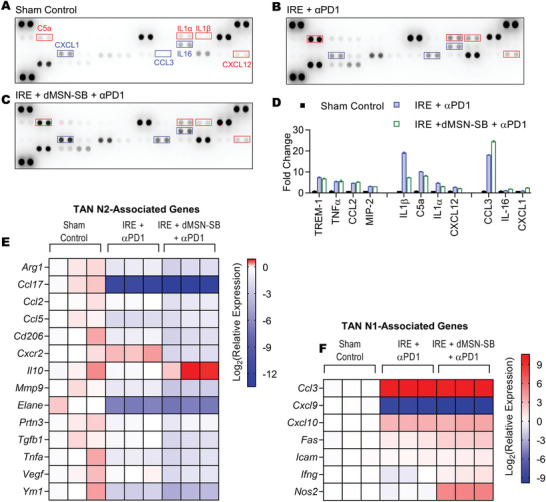
Figure 5.

Analyses of intratumoral cytokines and TAN phenotype. Cytokine array analyses of A) subcutaneous Panc02 tumors from sham control, B) IRE + αPD1, C) IRE + dMSN‐SB + αPD1 groups. Exposure time = 600 s. D) Quantification of cytokines whose expression was significantly altered after treatment with IRE + αPD1 or the triple therapy. Cytokines with higher expression in the IRE + αPD1 group were indicated using red boxes; those with higher expression in the triple therapy group were marked with blue boxes. Two dots were probed for each cytokine. Data are presented as mean ± SEM in bar graphs. Significant difference was evaluated using one‐way analysis of variance for multiple comparisons followed by Tukey post hoc analysis. Relative expression of E) N2‐ and F) N1‐ associated genes in TANs isolated from subcutaneous Panc02 tumors on day 7 after enrollment. Data are shown as heat map with a color scale. Each square represents an individual independent data point. Three replicates were included in each group.
