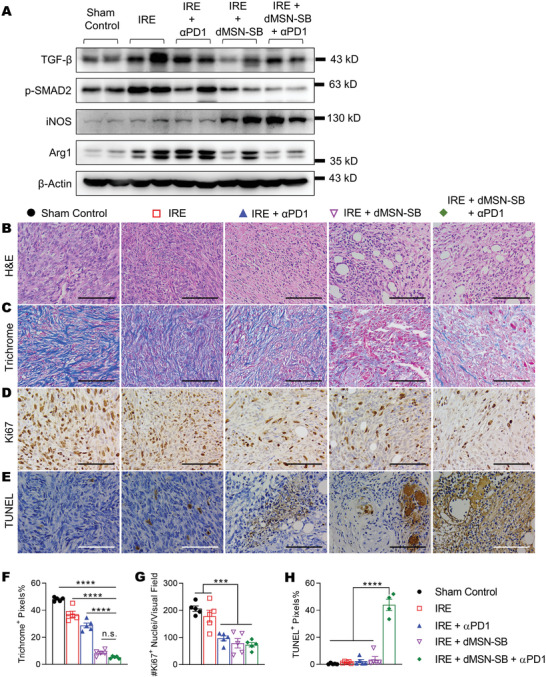
Figure 6.

Analyses of tumor stroma. A) Immunoblotting of TGF‐β, p‐SMAD2, iNOS, and arginase 1. Two independent Panc02 tumors were included in each group. Representative microscopic images of B) H&E, C,F) trichrome, D,G) Ki67, E,H)TUNEL IHC staining and respective quantification. Subcutaneous tumors were collected on day 7 after enrollment. Scale bar = 100 µm. Five 400× visual fields were imaged at random for quantification. Data in (B–H) are presented as mean ± SEM in bar graphs overlaid with individual data points. Significance was determined using one‐way ANOVA followed by Tukey post hoc analysis. ***p < 0.001, ****p < 0.0001, n.s. = not significant.
