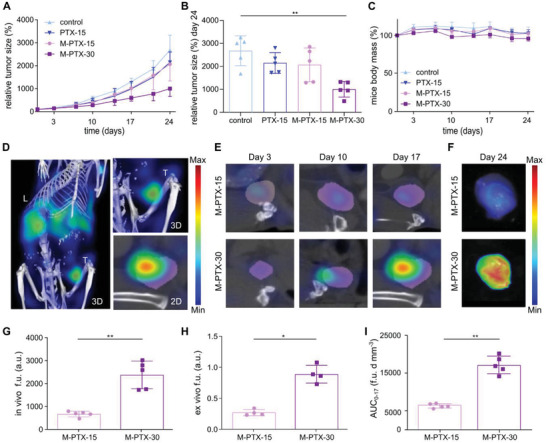
Figure 2.

Treatment efficacy and tumor accumulation monitoring of paclitaxel‐loaded polymeric micelles. A,B) At the end of the study, the relative tumor size was significantly decreased for the M‐PTX‐30 group as compared to PBS and free or encapsulated PTX dosed at 15 mg kg–1 groups. % values are calculated based on each individual tumor absolute size at day 0. C) Mouse body mass remained constant during treatment, demonstrating the tolerability of the interventions. % values are calculated based on the body mass of each mouse at day 0. D,E) Representative in vivo CT‐FMT images of the tumor localization of theranostic micelles exemplify the stable accumulation pattern for micelles dosed at 15 mg kg–1 PTX‐equivalent and the increasing accumulation pattern for micelles dosed at 30 mg kg–1 PTX‐equivalent. T = Tumor. L = Liver. F) Ex vivo FRI images of the tumor accumulation of Cy7‐labeled PTX‐micelles at the end of the study, demonstrated higher tumor accumulation for the double‐dosed micelles. G,H) Quantification of the in vivo (CT‐FMT; on day 17) and ex vivo (FRI; on day 24) fluorescence units (f.u.) of Cy7‐labeled PTX‐micelles in tumors showed disproportionally higher accumulation of the double‐dosed micelles after the last micelles injection. I) The cumulative concentrations (AUC; area under the curve in fluorescence units*days*mm–3 (f.u. d mm–3) of Cy7‐labeled PTX‐micelles in tumors, measured between day 0 and day 17, confirmed the disproportionally higher tumor accumulation for the 30 mg kg–1‐dosed micelles versus the 15 mg kg–1‐dosed micelles. Values represent average ± SD. * p < 0.05, ** p < 0.01. Panel B: n = 5 per group; unpaired, nonparametric one‐way ANOVA and Dunn's multiple comparison test. Panels G,I: n = 5 per group; unpaired, nonparametric, two‐tailed t‐test. Panel H: n = 4 per group; unpaired, nonparametric, two‐tailed t‐test.
