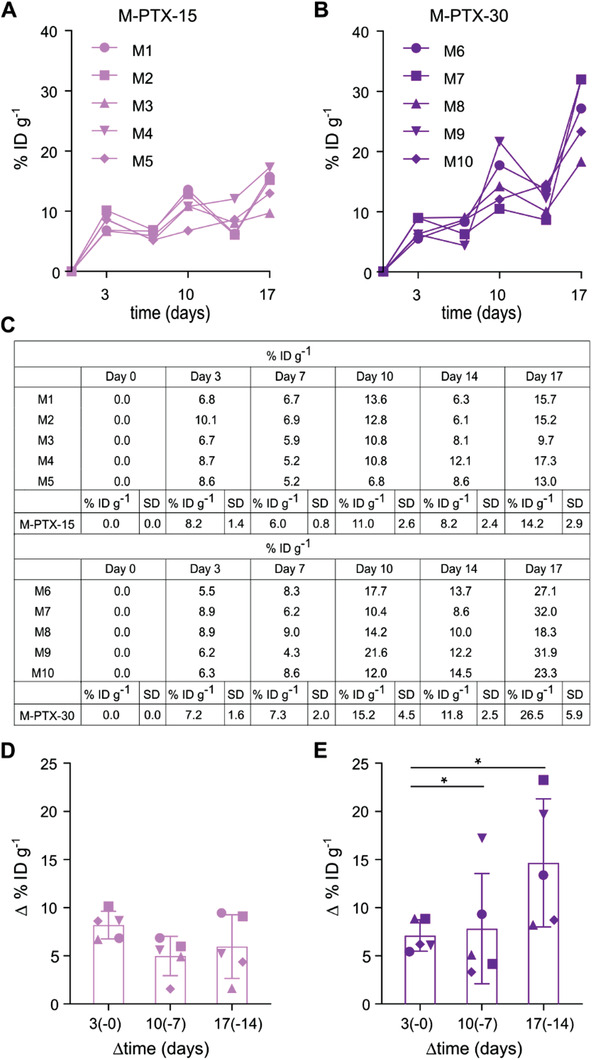
Figure 3.

Quantitative assessment of individual EPR effect dynamics during treatment. A,B) Theranostic micelles were administered on days 0, 7, and 14, and therapeutic micelles on days 3, 10, and 17. Comparable % ID g–1 of micelles were found in 4T1 tumors after the 1st injection for the 15 and the 30 mg kg–1 groups, while cumulative accumulation patterns upon subsequent injections indicated a disproportionally large increase in EPR‐mediated tumor accumulation for the 30 mg kg–1 group. C) The table summarizes the % ID g–1 values for the 15 and 30 mg kg–1 groups on days 0, 3, 7, 10, 14 and 17. D,E) The evolution of and variability in EPR‐mediated micelle accumulation in tumors was quantified via determining the difference (i.e., ∆ % ID g–1) between the % ID g–1 of Cy7‐PTX‐micelles accumulated 3 d after i.v. injection and the % ID g–1 of Cy7‐PTX‐micelles present in tumors just before that respective i.v. injection. The ∆ % ID g–1 values slightly decreased on average over time for the 15 mg kg–1 group and slightly increased for the 30 mg kg–1 group. Inter‐individual variability in EPR‐mediated tumor accumulation increased for both groups. Values represent average ± SD (n = 5 per group). F‐tests on unpaired, parametric, two‐tailed t tests with Welch's correction were performed to compare variance between the different time points. In addition, paired, parametric, two‐tailed t‐tests were performed to compare ∆ % ID g–1 values between each injection for both groups. Unpaired, parametric, two‐tailed t‐tests were performed to assess differences in micelle accumulation (∆ % ID g–1) between M‐PTX‐15 and M‐PTX‐30 at the different time points. * p < 0.05.
