Figure 4.

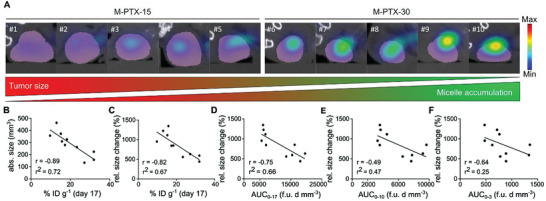
Nanomedicine tumor accumulation correlates with antitumor response. A) 2D CT‐FMT images on the transverse plane taken on day 17 show that tumors which strongly accumulate PTX‐micelles have smaller sizes than tumors which accumulate micelles less efficiently. Tumor accumulation is shown as blue‐to‐red fluorescence clouds. CT‐segmentations of tumors are presented in purple. B–F) Correlation of static and dynamic polymeric micelle tumor accumulation with therapy outcome. Static assessment of polymeric micelle accumulation at day 17 (i.e., after three theranostic and three therapeutic doses) shows a very good correlation with antitumor response for both B) absolute and C) relative tumor growth kinetics. Dynamic assessment of cumulative micelle accumulation over time (i.e., the area under the curve; AUC) also correlated well with therapy outcome. The relative size change in tumor growth (in %) between day 3 and 24 was correlated with micelle AUC (fluorescence units*days*mm–3 (f.u. d mm–3)) upon D) all three, E) the first two, and F) only the first injection, showing that prolonged monitoring produces more favorable results. Spearman´s correlation coefficient (r) and goodness‐of‐fit for linear regression (r 2) using alpha threshold of 0.05 were calculated using GraphPadPrism 9.
