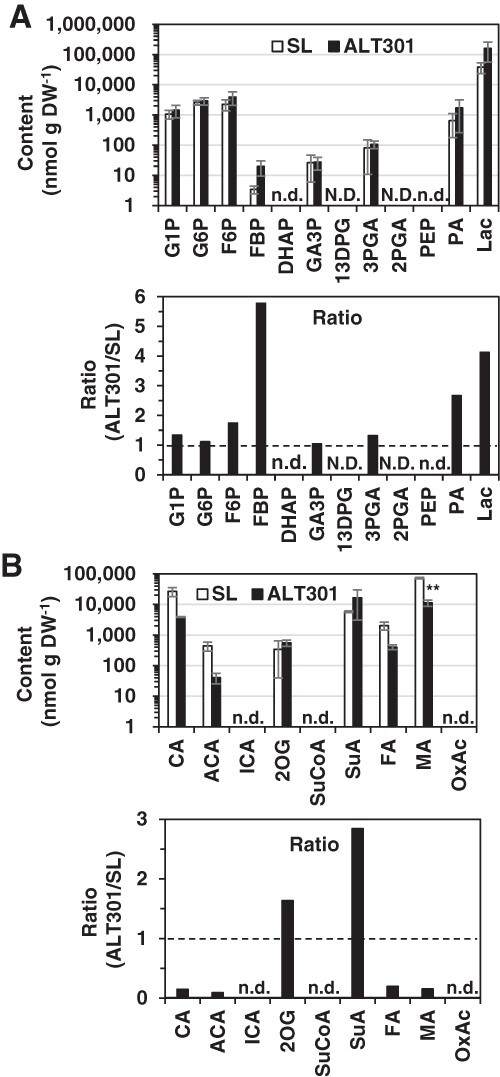
Fig. 1.

Comparison of contents of the metabolites associated with glycolysis (A) and the TCA cycle (B) between SL and ALT301 under normal growth condition. On the abscissa, the metabolites are aligned according to metabolic pathways (see Supplementary Fig. S3). Values are the content (nmol g dray weight [DW]−1; mean ± SE, n = 3 from three independent experiments) (top) and the ratio relative to SL (bottom) in which broken line indicates the ratio value of 1 (values and the results of statistical analysis, see Supplementary Table S1). Statistically significant difference between SL and ALT301 is indicated with asterisk (**P < 0.01, Welch’s t-test). N.D. means ‘not determined’ and n.d. means ‘not detected’. Abbreviations: DHAP, Dihydroxyacetone phosphate; 13DPG, 1,3-Diphospho-D-glycerate; 2PGA, 2-Phosphoglycerate; other metabolites, see Supplementary Table S1.
