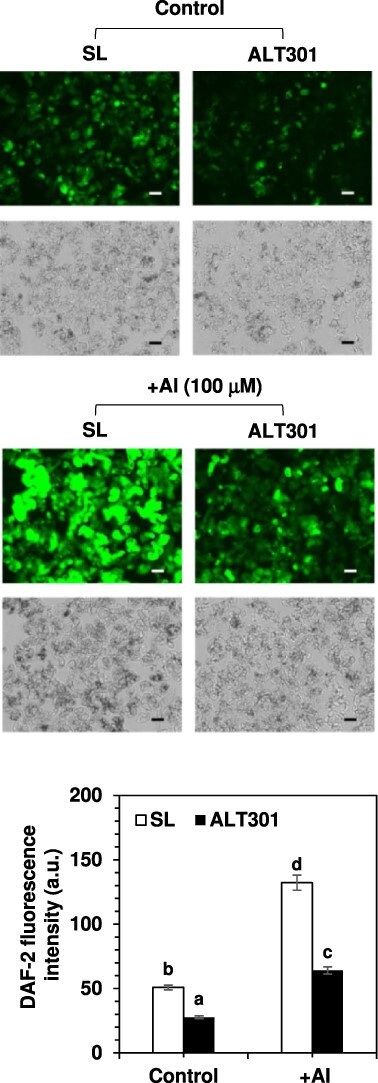
Fig. 10.

Comparison of NO production between SL and ALT301 under Al-treatment condition. Cells were treated without (control) or with 100 μM Al (+Al) for 18 h, and then NO production was determined. The fluorescence image of NO production in cells (top), which was obtained by staining with DAF-2 DA, is indicated with the bright image of cells (bottom). All the fluorescence images were obtained under the same exposure time (1/1.5 sec). The experiments were repeated three times independently, and reproducible results were obtained. Here shows representative images. Bar indicates 100 μm. NO level was quantitatively determined as DAF-2 fluorescence intensity (mean gray value per cell area [150 μm × 150 μm]) (arbitrary unit). Different letters indicate statistically significant differences among 4 samples (P < 0.05, Tukey–Kramer test). Values are the mean ± SE (n = 45 cell areas from three independent experiments).
