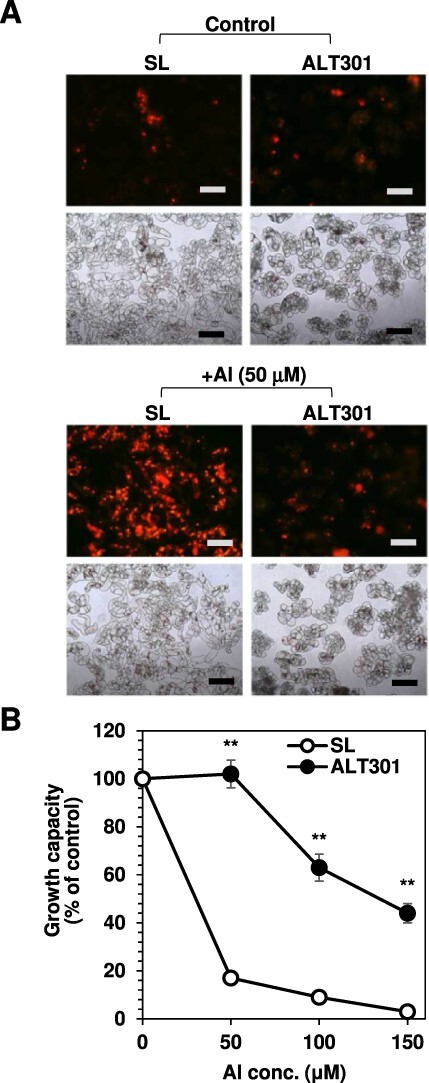
Fig. 6.

Comparison of ROS production (A) and growth capacity (B) between SL and ALT301 under Al-treatment condition. Cells were treated without (control) or with Al (+Al) for 18 h, and then ROS production and growth capacity were determined. In (A), fluorescence image of ROS production in cells (top) obtained by staining with dihydroethidium and bright image of cells (bottom) are indicated. All the fluorescence images were obtained under the same exposure time (1 sec). The experiments were repeated three times independently, and reproducible results were obtained. Here shows representative images. Bar indicates 200 μm. In (B), significant differences between SL and ALT301 are indicated with asterisks (**P < 0.01, Welch’s t-test). Values are the mean ± SE (n = 7 from seven independent experiments).
