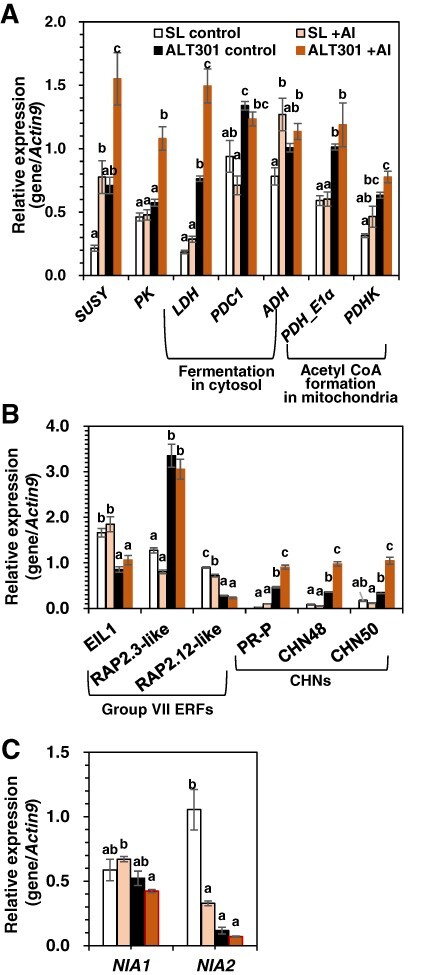
Fig. 8.

Expression of the genes related to glycolysis and fermentations (A), ethylene signaling (B) and the genes (NIA1, NIA2) encoding NR (C) in SL and ALT301 under Al-treatment condition. Cells were treated without (control) or with Al (+Al, 100 μM) for 18 h. Then, cells were harvested for expression analyses of the genes by real-time RT-PCR. Different letters in each gene analysis indicate statistically significant differences among four samples (P < 0.05, Tukey–Kramer test). Values are the mean ± SE (n = 4 from four independent experiments in A; n = 3 from three independent experiments in B; n = 3 from three independent experiments in C).
