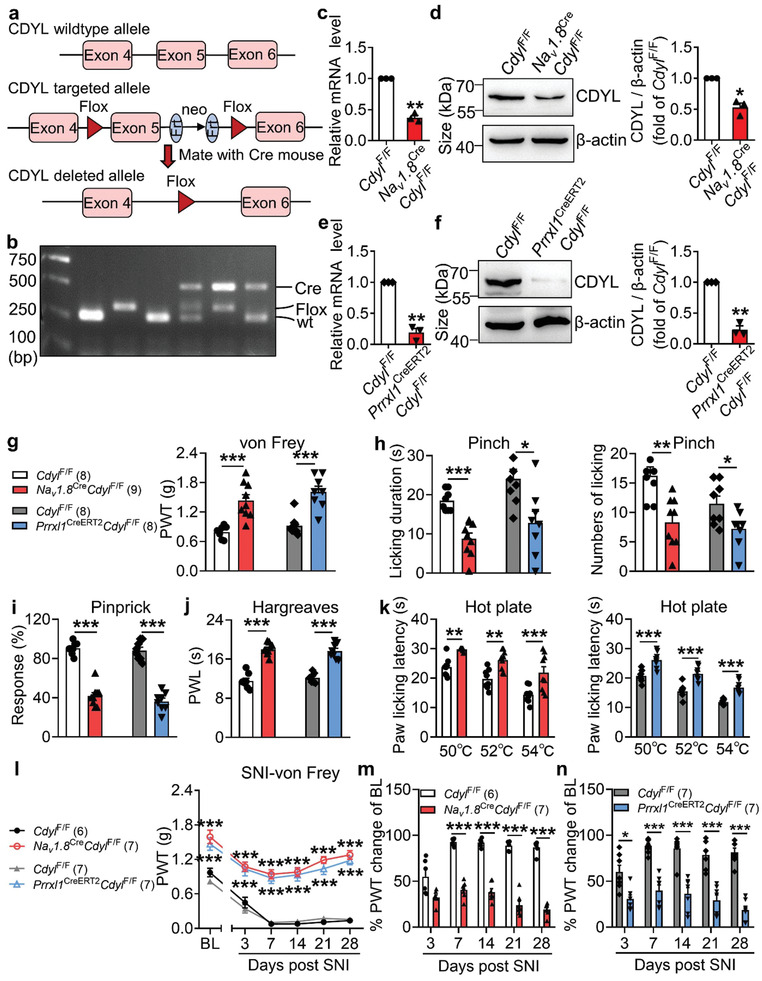
Figure 2.

Loss of CDYL in male mice DRG decreases pain sensitivity. a) Strategy of conditional Cdyl knockout mice. b) PCR analysis of genomic DNA from intercrosses. c,e) The Cdyl mRNA level in DRG from homozygous genotypes of the Cdyl‐floxp mice crossed with Nav1.8‐Cre (Nav1.8 Cre Cdyl F/F) (c) or Prrxl1‐CreERT2 (Prrxl1CreERT2 Cdyl F/F) (e) mice was examined by qRT‐PCR. n = 4 biological replicates. Student's paired t test, **p < 0.01. d,f) Representative images of CDYL expression in Nav1.8 Cre Cdyl F/F mice (d) or Prrxl1CreERT2 Cdyl F/F mice (f) by western blotting (left). Quantification of CDYL expression in the left image (right). n = 4 biological replicates. Student's paired t test, *p < 0.05, **p < 0.01. g) Basal PWT was assessed by von Frey test. Student's unpaired t test, ***p < 0.001. h) Licking durations (left) and numbers (right) responding to pinching stimuli were measured. Student's unpaired t test, *p < 0.05, **p < 0.01, ***p < 0.001. i) Response to pinprick stimuli were assessed by pinprick test. Student's unpaired t test, ***p < 0.001. j) Basal PWL was assessed by Hargreaves's method. Student's unpaired t test, ***p < 0.001. k) Response to noxious heat stimuli was assessed by hot plate test. Student's unpaired t test, **p < 0.01, ***p < 0.001. l) Time course of PWT after SNI. Two‐way ANOVA with Sidak's post‐hoc test, ***p < 0.001. m,n) Percentages of PWT changes of baseline at different time points after SNI. Two‐way ANOVA with Sidak's post‐hoc test, *p < 0.05, ***p < 0.001. Data are the mean ± SEM.
