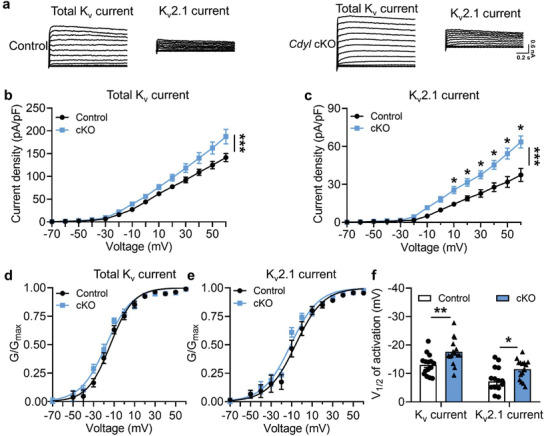
Figure 5.

Loss of CDYL enhances total Kv and Kv2.1 currents in DRG. a) Representative traces of total Kv (left) and Kv2.1 current (right) in DRG neurons from control and Cdyl cKO mice. Scale bars, 0.2 s and 0.6 nA. b, c) Densities of total Kv (b) and Kv2.1 current (c) in DRG neurons from control and Cdyl cKO mice. Two‐way ANOVA, group effect: ***p < 0.001, shown at the end of the lines; post‐test: Sidak's post‐hoc test, *p < 0.05, shown above the lines. d,e) The activation curves of total Kv (d) and Kv2.1 current (e) in the DRG neurons from control and Cdyl cKO mice. f) The half‐activation values (V1/2) of total Kv and Kv2.1 current in the DRG neurons from control and Cdyl cKO mice. Student's unpaired t test, *p < 0.05, **p < 0.01. n control = 15, n cKO = 15. Data are the mean ± SEM.
