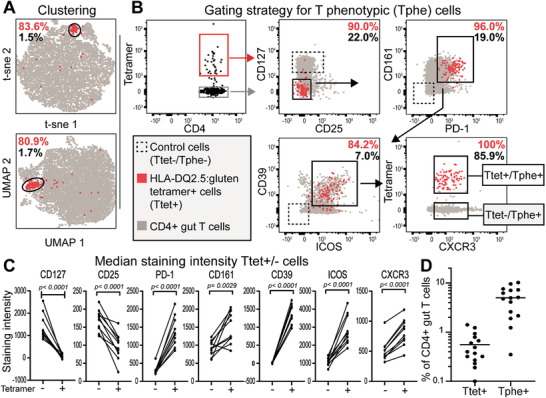
Figure 1.

Characteristics and frequency of Tphe cells. a) t‐sne and UMAP plot of gut‐derived CD4+ T cells from a celiac disease (CeD) patient. Percentages indicate HLA‐DQ2.5:gluten‐tetramer+ (Ttet+) (red) and CD4+ gut (grey) T cells in general locating within the circled cluster. b) Gating strategy for CD4+ gut T cells to obtain the Tphe phenotype. c) Median staining intensity of the seven indicated cell‐surface markers defining the Tphe phenotype and used to produce the t‐sne and UMAP plots in (a). Only the samples from n = 10 untreated patients analyzed in the same Flow cytometer were used for this analysis. Paired t‐test was performed to obtain the p‐values. d) Frequency of Ttet+ and Tphe+ cells gated as in (b) in n = 15 untreated CeD patients.
