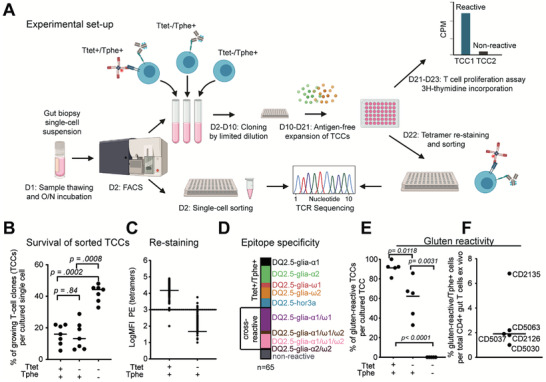
Figure 2.

T cell proliferation assay and experiment layout. a) Cryopreserved single‐cell suspension from celiac disease (CeD) gut biopsies were thawed, incubated overnight, and stained on the day 2 with a cocktail of five HLA‐DQ2.5:gluten tetramers and a mix of antibodies for FACS sorting. Three populations (Ttet+/Tphe+, Ttet−/Tphe+, Ttet−/Tphe−) were sorted either for T‐cell receptor sequencing (single‐cell) and/or for generating T cell clones (TCCs). The TCCs were generated by performing cloning by limited dilution followed by antigen‐free expansion. The TCCs were then screened for antigen‐specific proliferative responses in a T cell proliferation assay using 3H‐thymidine incorporation, recorded as counts per minute (cpm), and expressed as stimulation index (SI) (cpm after gluten stimulation/cpm after solvent stimulation). TCCs with SI > 1.8 were considered reactive. TCCs were also re‐stained with the cocktail of HLA‐DQ2.5:gluten tetramers used during sorting. TCCs were then sorted in 96‐well plates for TCR sequencing. b) Frequency of successfully generated TCCs per cultured single CD4+ gut T cell from each of the indicated FACS‐sorted populations Ttet+/Tphe+, Ttet−/Tphe+, Ttet−/Tphe− (n = 7 untreated CeD patients). c) HLA‐DQ2.5:gluten‐tetramer re‐staining intensity (log median fluorescence intensity – MFI) summarized for TCCs generated from Ttet+/Tphe+ sorted (n = 83 TCCs) and Ttet−/Tphe+ sorted (n = 209 TCCs) CD4+ T cells from five untreated CeD patients. The horizontal bar indicates the median value. d) Fine specificity of Ttet+/Tphe+ sorted TCCs (n = 65 TCCs) tested with peptides representing five immunodominant epitopes that were used for HLA‐DQ2.5:gluten‐tetramer sorting (SI > 1.8) e) Frequency of TCCs with proliferative response against deamidated gluten antigen per total number of cultured TCCs from indicated populations in vitro. Each dot represents the percentage within a separate participant. f) Frequency CD4+ gut T cells with proliferative response against deamidated gluten in vitro (n = 5 untreated CeD patients). The horizontal bar indicates the median value. Horizontal bars indicate the median value. p‐Values calculated by two‐tailed paired t‐tests in (b) and (e).
