
Figure 2.
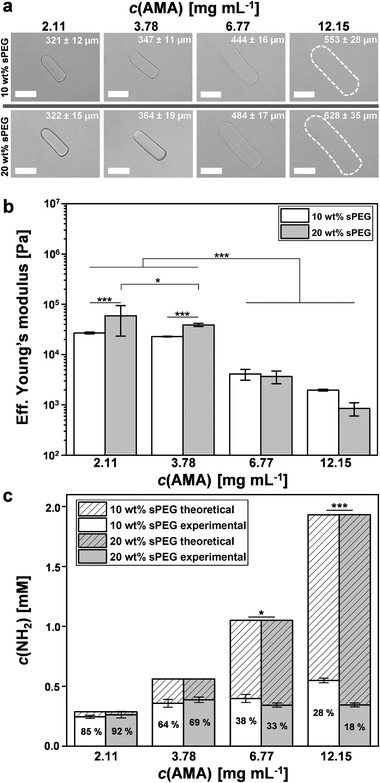
AMA concentration dependent characteristics. a) Bright field images of AMA microgel rods after purification in water with different AMA concentrations. Associated average lengths and standard deviations are indicated in each image. Data presented as mean ± SEM, n = 20. Dashed outlines indicate microgel rod edges. Scale bars represent 200 µm. The data distribution of all measured AMA microgel rod lengths in water and cell culture within the 10 and 20 wt% samples is shown in Figure S3 of the Supporting Information. b) Young's moduli of AMA microgel rods in PBS buffer solution (phosphate‐buffered saline: 1×, pH 7.4). Error bars represent ± SEM, n = 3 microgels per type at a minimum of ten different locations, P‐values are calculated using one‐way ANOVA with Bonferroni correction, *P < 0.05, *** P < 0.001. c) Theoretical and measured amine incorporation quantification of AMA microgel rods via ninhydrin assay after microgel purification. The AMA incorporation efficiency (%) is indicated within columns. Data presented as mean ± SEM, n = 3 per microgel type, P‐values are calculated using one‐way ANOVA with Bonferroni correction, *P < 0.05, *** P < 0.001.