. 2022 Feb 1;12(7):4005–4015. doi: 10.1039/d1ra08563h

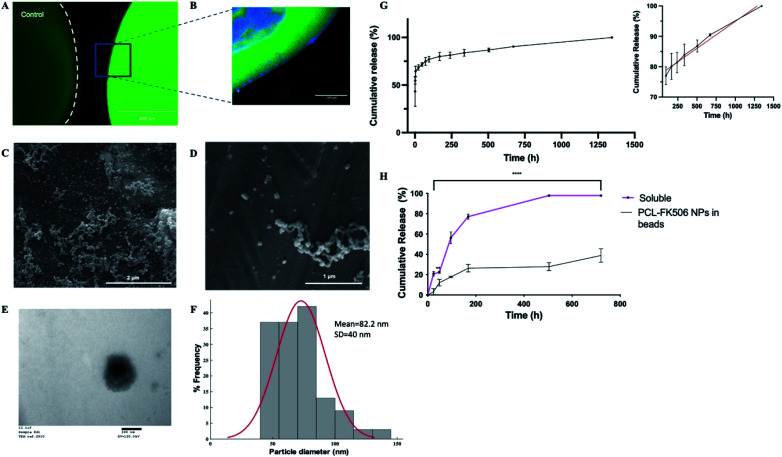
Fig. 6. Controlled release of FK506 from implantable delivery system. (A) Fluorescence micrographs of control alginate bead and alginate bead with FITC positive PCL nanoparticles encapsulated in the HA-ALG coating, scale bar = 400 μm. (B) Confocal micrograph of section through the edge of an alginate bead with DAPI in the core and FITC positive PCL nanoparticles in the coating, scale bar = 100 μm. (C and D) Representative SEM images of PCL NPs, scale bars = 2 μm and 1 μm respectively. (E) Representative TEM image of PCL NPs, scale bar = 100 nm. (F) Histogram showing the size range of the nanoparticles. (G) Total cumulative release of FK506 from PCL nanoparticles over 2 months. The inset represents the linear release profile of FK506-nanoparticles (black line) and best fit zero-order release kinetics (red line) from 96 to 1344 h. Data expressed as mean ± SD (N = 3). (H) Release from alginate beads of FK506 incorporated either in solution or in nanoparticles within the outer layer. Data are expressed as mean ± SD (N = 3) with 3 repeats per condition, two-way ANOVA with Bonferroni's multiple comparison test where **p < 0.01 and ****p < 0.0001.

Fig. 6