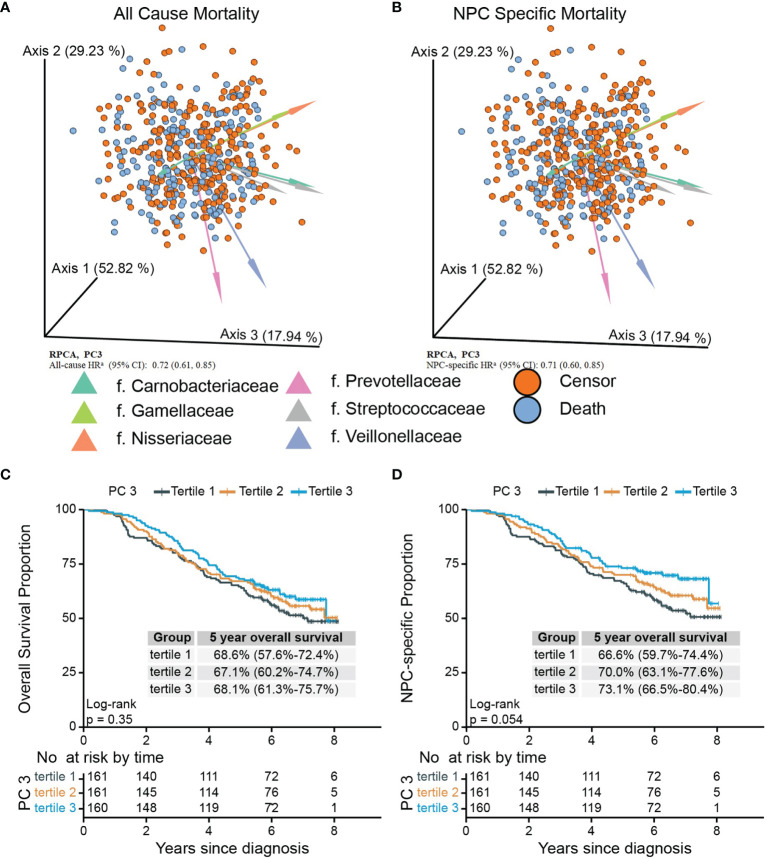
Figure 2.
Biplots of RPCA by survival status (A) and NPC-specific survival status (B) and Kaplan–Meier curves of overall (C) and NPC-specific survival (D) proportion between tertiled PC3 groups generated from RPCA. PC3 of RPCA were significant mortality predictor (A, B) in Cox model with all-cause HR of 0.72 (95% CI, 0.61–0.85) and NPC-specific HR of 0.71 (95% CI, 0.60–0.85). Arrows in (A) and (B) were top 8 taxa influencing the principal component axis. Axis1, axis2, and axis3 were equal to PC1, PC2, and PC3. The axes were labeled with the variation proportion that PCs explain. Sample loadings PC3 were z-normalized in Cox models. aHRs were adjusted for age at diagnosis, sex, sequencing running number, tobacco use, the number of missing or filled tooth, cancer stage, treatment pattern, saliva sampling season, BMI before treatments, alcohol use, diagnosis calendar year, and residential community and Faith’s PD. PC3 were z-normalized. RPCA, robust Aitchison principal-component analysis; NPC, nasopharyngeal carcinoma; Faith’s PD, Faith’s phylogenetic diversity.

