Fig. 9.
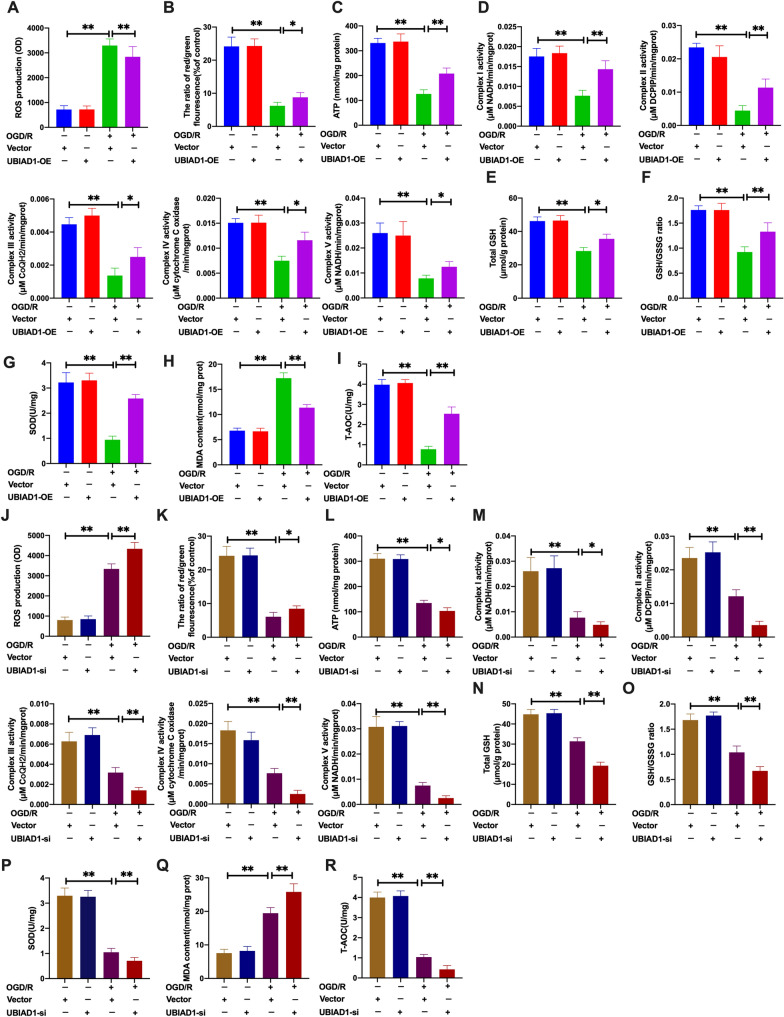
Overexpression of UBIAD1 inhibited oxidative stress by restoring mitochondrial dysfunction in OGD/R-mediated ferroptosis in vitro. The levels of oxidative stress in UBIAD1-OE and UBIAD1-siRNA neurons, and corresponding experimental groups. A and J ROS production as detected using DCFH-SA assay. B and K Level of mitochondrial membrane potential in various experimental groups as determined using JC-1 staining. C and L ATP production in various experimental groups as evaluated with the ATP assay kit. D and M The activity of mitochondrial complexes I, II, III, IV, and V in various experimental groups. E, F and N, O The level of total GSH and GSH/GSSG ratio in various experimental groups as determined by GSH assay kit. G and P Changes in SOD production in various experimental groups as detected with the WST-8 assay kit. H and Q The level of MAD generation in various experimental groups as determined with the lipid peroxidation assay kit. I and R The level of T-AOC in various experimental groups as evaluated using ABTS assay kit. N = 3, all data are expressed as the mean ± SD, *P < 0.05, **P < 0.01; CTR + vector-UBIAD-OE group vs. OGD/R + vector-UBIAD-OE group and OGD/R + vector-UBIAD-OE group vs. OGD/R + UBIAD-OE group; CTR + vector-UBIAD-siRNA group vs. OGD/R + vector-UBIAD-siRNA group and OGD/R + vector-UBIAD-siRNA group vs. OGD/R + UBIAD-siRNA group

