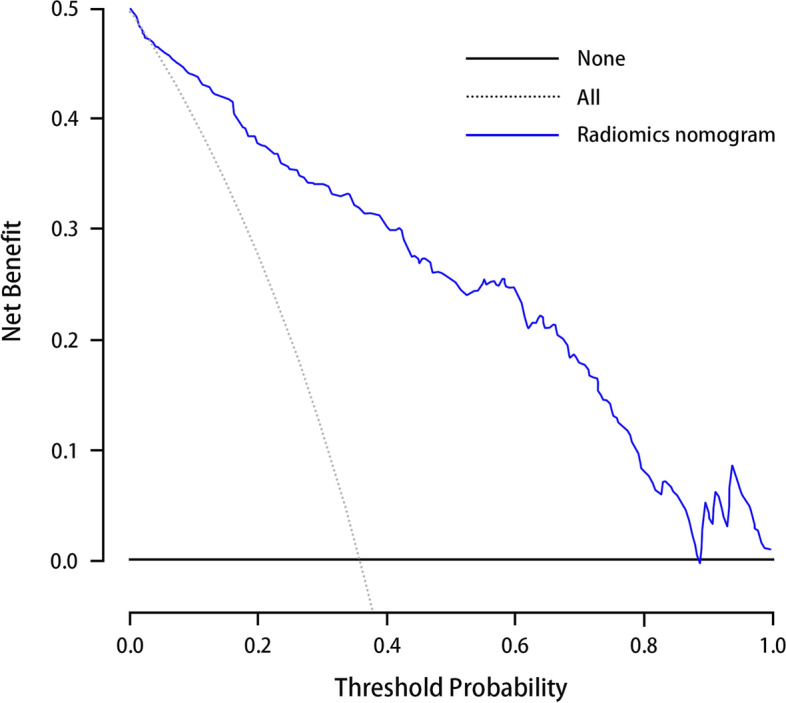
Fig. 7.

Decision curve analysis for radiomics nomogram in the training cohort. The x-axis indicates the threshold probability and y-axis measures the net benefit. The blue line represents the radiomics nomogram. The gray line represents the assumption that all patients have LN metastases. The black line represents the assumption that no patients have LN metastases. The decision curve showed that when the threshold probability is between 0.04 to 0.88, more benefit was added from the radiomics nomogram than either the treat-all-patients scheme or the treat-none scheme
