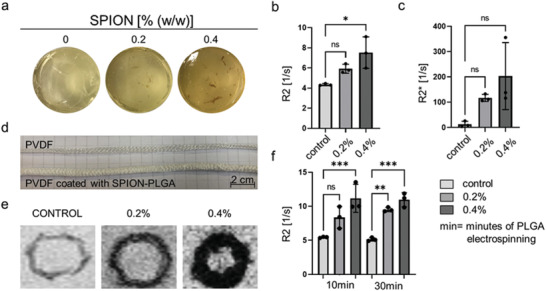
Figure 2.

MRI investigation of SPION‐labeled PLGA fibers. a) Gelatin phantoms containing 0%, 0.2%, and 0.4% (w/w) of SPION. b,c) R2 and R2* analyses of SPION‐labeled PLGA fibers (both concentrations) in comparison to the unlabeled control. d) Visual comparison between an uncoated and SPION‐labeled PLGA‐coated PVDF tubular scaffold. e) T2 weighted MRI images of PVDF tubular scaffolds coated with 0.2% and 0.4% (w/w) of SPION. f) R2 analyses of different PLGA electrospinning time, 10 and 30 min, containing 0.2% and 0.4% (w/w) of SPION. All values were obtained in triplicates: mean ± SD; t‐test with Tukey post hoc correction test was applied; ns > 0.05, * p < 0.05, ** p < 0.01, *** p < 0.001, and **** p < 0.0001.
