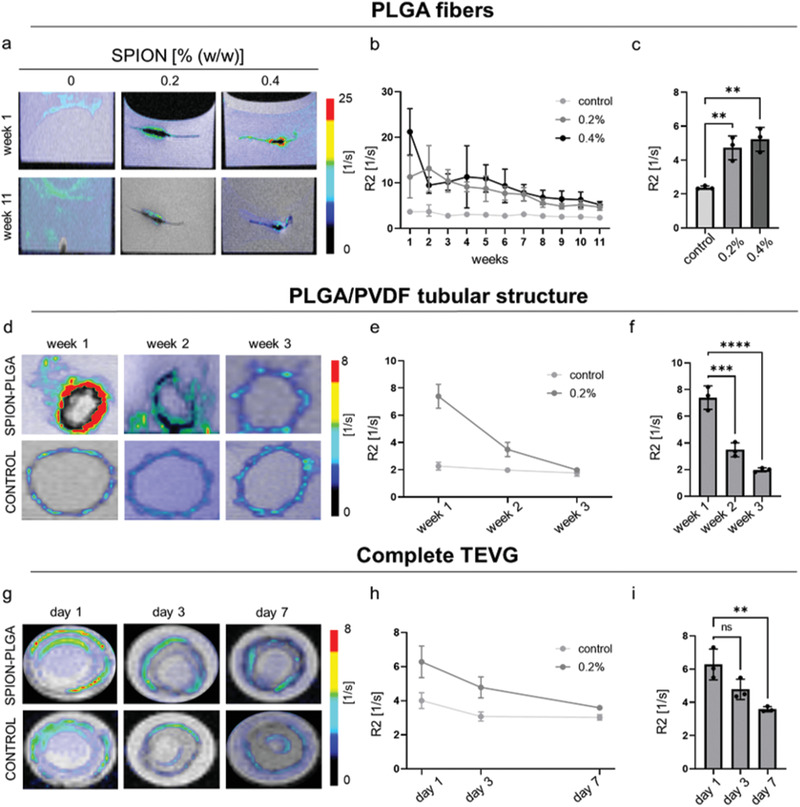
Figure 3.

Monitoring of PLGA fiber degradation by MRI. a) Superimposed R2 color maps on T2 weighted images of 0.2% and 0.4% (w/w) SPION‐labeled PLGA fibers embedded in fibrin gel during the first week (top) and the last week (bottom) of the experiment. b) R2 relaxation rates of the different PLGA fibers over time. c) Comparison of R2 values between SPION‐labeled PLGA fibers and the unlabeled control at the end of the experiment. d) R2 color maps superimposed on T2 weighted images of SPION‐labeled PLGA fibers combined with the PVDF tubular scaffold (top) and of unlabeled controls (bottom) in PBS. e) R2 relaxation rates of 0.2% SPION‐labeled PLGA fibers in comparison to the unlabeled control. f) R2 values of 0.2% SPION‐labeled PLGA fibers decrease as a result of fibers degradation. g) T2 weighted MRI images of the complete TEVGs with SPION‐labeled (top) and unlabeled PLGA fibers (bottom), with corresponding superimposed R2 color map. h,i) R2 relaxometry confirms the degradation of 0.2% SPION‐labeled PLGA fibers in comparison to the unlabeled controls and their faster degradation in the presence of SMCs and ECs. All values were obtained in triplicates: mean ± SD; one‐way ANOVA b,e,h) and t‐test c,f,i) with Tukey post hoc correction test were applied; ns > 0.05, * p < 0.05, ** p < 0.01, *** p < 0.001, and **** p < 0.0001.
